The Trade Desk (TTD) has entered a significant technical inflection point following an extended period of price weakness. Across multiple timeframes—3-month, 1-year, and 5-year charts—the stock now sits near multi-year support levels after a series of steep declines. This positioning opens the door for an asymmetric upside opportunity, particularly when paired with a long-dated options strategy designed to capitalize on delta expansion and volatility normalization.
In this article, we examine TTD from every angle: technical structure, financial strength, recent news, analyst sentiment, insider activity, options flow, and finally the specific LEAPS trade setup. The goal is to construct a well-researched, risk-controlled bullish thesis with a clearly defined execution plan.
1. Technical Analysis

On the 3-month chart, TTD recently hit a fresh 3-month low following a steep, rapid decline. RSI dipped into somewhat oversold territory, signaling exhaustion in selling pressure. MACD is flattening out, suggesting bearish momentum may be losing strength. This short-term structure typically precedes a stabilization phase or early reversal.
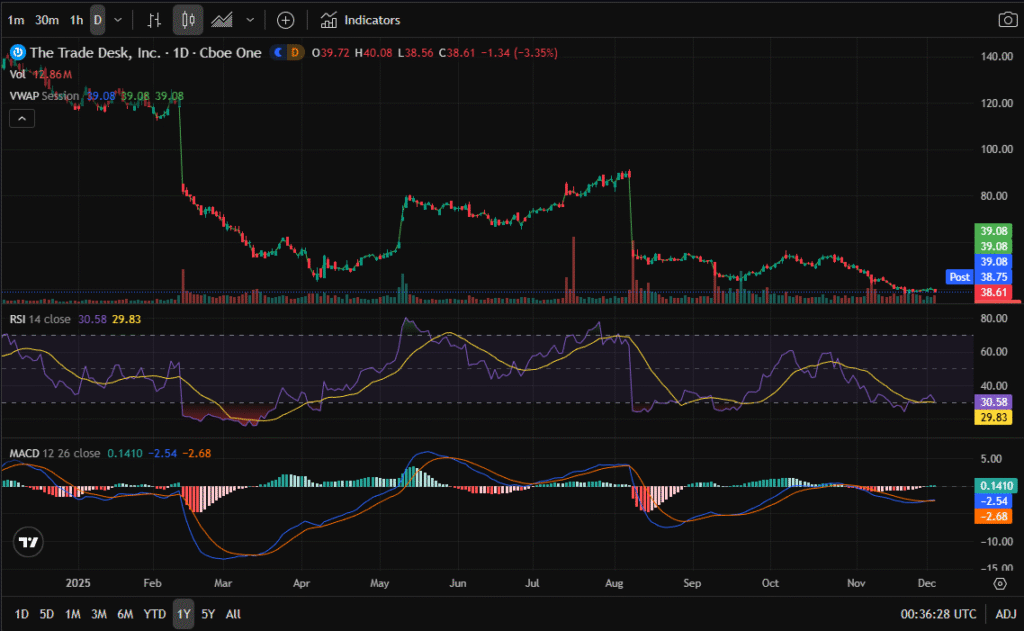
Zooming out to the 1-year chart reveals a nearly identical pattern: a steep drop into a 1-year low accompanied by an RSI reading near oversold levels. The larger trend shows extended downward pressure but also demonstrates that TTD often rebounds sharply after major resets.

On the 5-year chart, the price now sits on a major multi-year support band. Historically, TTD has experienced deep drawdowns followed by strong recoveries. The RSI again leans oversold, and MACD is close to leveling off. This long-term support zone makes the current retracement structurally significant and attractive for a bullish LEAPS entry.
2. Financial Analysis
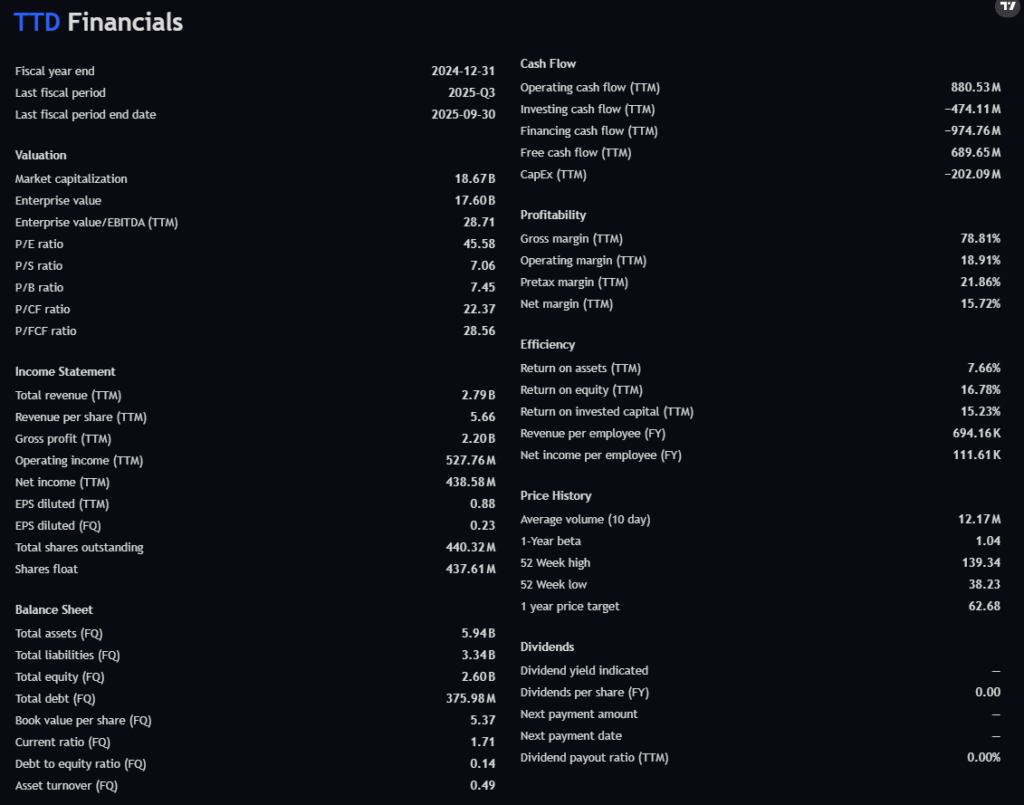
TTD’s fundamentals remain strong despite the temporary stock price deterioration:
- Positive free cash flow in the hundreds of millions
- Exceptional gross margin (78%+)
- Healthy net margin (~15%)
- Strong ROE, ROA, and ROIC, all in double digits
- Very low debt-to-equity (0.14)
- Reasonable P/B ratio (7.45)
- High P/E (45.58) — expensive, but normal for an ad-tech growth stock with durable competitive advantages
These metrics support the long-term bullish case. TTD is not a distressed company—its valuation simply reset due to sentiment rather than deteriorating fundamentals.
3. News Headlines Analysis

Recent headlines echo concerns about increased competition and leadership changes, but also point toward growth opportunities and improving sentiment among institutional funds. The tone of the news is mixed yet stabilizing. Importantly, nothing indicates structural business failure—only cyclical market pressure.
This aligns well with a LEAPS recovery strategy: strong company, temporarily weak stock.
4. Analyst Price Targets

Analyst revisions show substantial downward adjustments across major firms. Despite the cuts, the average price target remains significantly above the current stock price, with many targets still in the $53–$97 range. Analysts frequently reduce targets after steep drops, often marking capitulation moments where downside is already priced in.
Historically, TTD has exceeded revised targets after major resets.
5. Insider and Congressional Trading
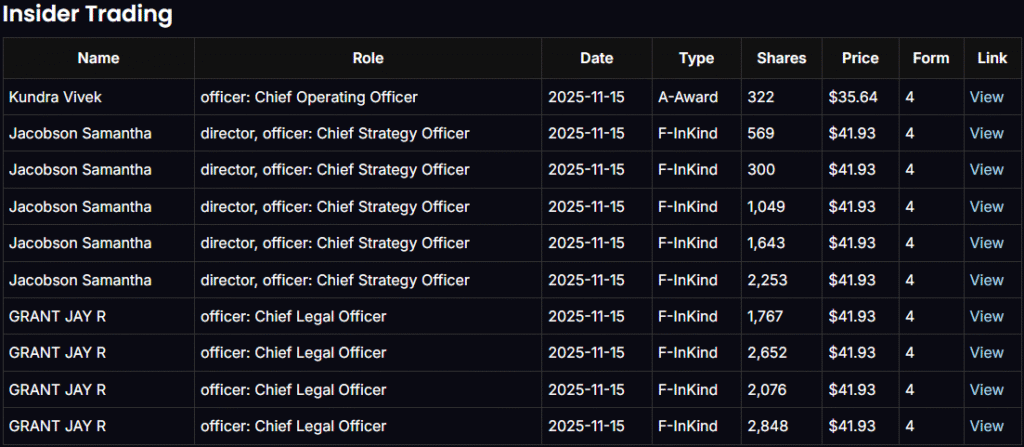


Insiders filed multiple transactions, mostly form-based in-kind transactions, not discretionary buying or selling. Nothing indicates panic selling.
Congressional disclosures show occasional purchases, indicating some long-term optimism from policymakers. No recent heavy liquidation has occurred.
Collectively, insider and legislative activity does not confirm bearishness.
6. Options Flow Analysis

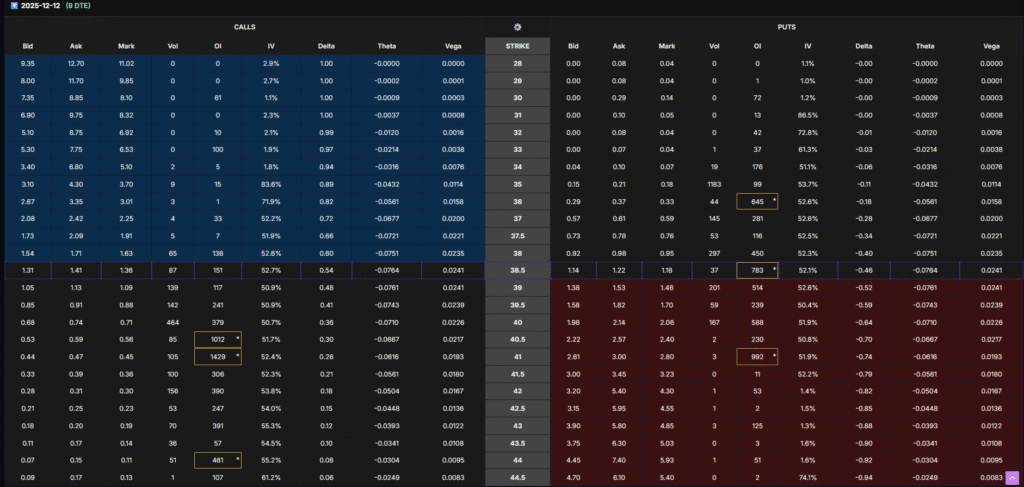
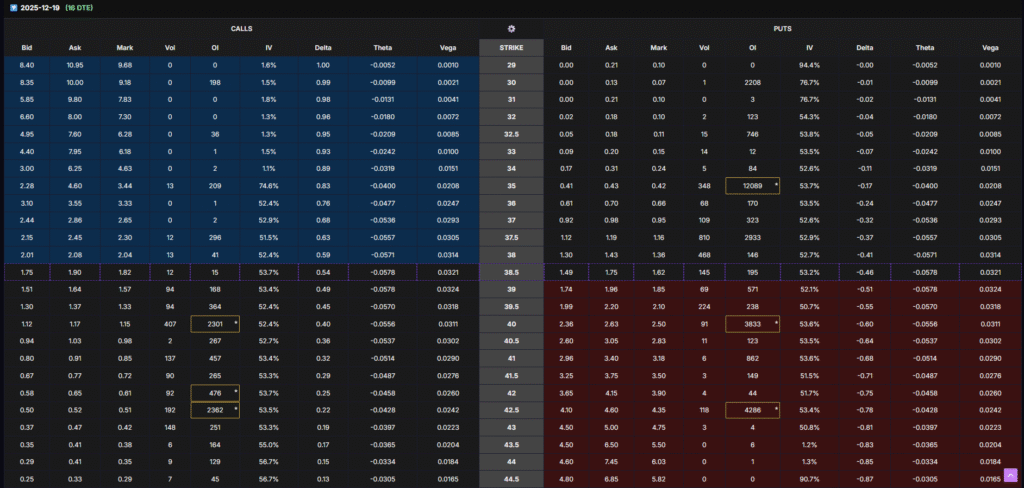
On the call side, highest open interest clusters around $47.5, $50, $55, and $65 strikes in nearer expirations. These are not bullish signals on their own, but they reflect where traders expect magnet zones and recovery targets.
However, the LEAPS chain (408 DTE) shows particularly strong OI in ITM and slightly ITM calls between $30 and $40, which indicates institutional positioning for long-term upside rather than short-term speculation.
This validates the use of a bullish LEAPS strategy.
7. The LEAPS Options Setup (408 DTE — January 2027)
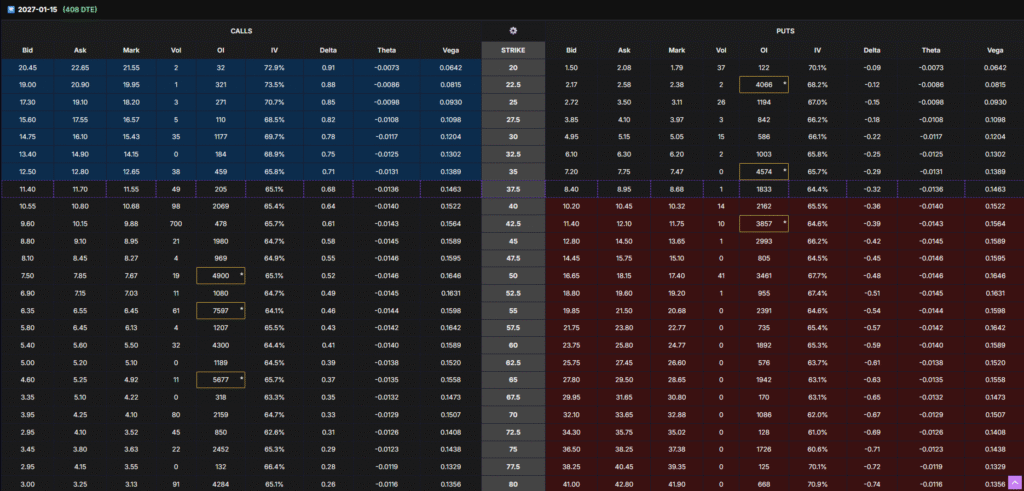
We analyzed deep ITM, mid ITM, and slightly ITM calls. After evaluation, the best strike based on delta, OI, vega exposure, and risk profile is:
➡️ 2027-01-15 $35 Call (408 DTE)
Why This Strike Is Optimal:
- Delta = 0.71, giving almost stock-like movement with leverage
- OI = 459, providing excellent liquidity
- Vega = 0.1389, allowing strong gains if IV expands
- Theta is minimal, making it ideal for multi-month holds
- Slightly ITM but not too expensive
- Perfect positioning after a steep drop for a delta expansion rebound trade
We are not holding until expiration. We aim to hold 1–4 months, targeting:
✔ 60% minimum profit (conservative)
✔ 80–100% preferred target range
If the stock does not recover within a couple of months, we will roll out to preserve the position.
8. Multi-Batch Entry Strategy (VERY IMPORTANT)
To manage risk and reduce emotional decision-making:
Batch 1 — Enter Now
If the LEAPS options price (not stock price) drops by –40% to –50%, we will:
Reanalyze and potentially enter Batch 2
If Batch 2’s options price also drops –40% to –50%, we will:
Reanalyze and consider Batch 3
This strategy prevents over-exposure while allowing us to average into extreme lows.
RISK DISCLAIMER
This article is for educational purposes only and not financial advice. Options involve substantial risk and are not suitable for all investors. Only risk capital should be used.
You should:
- Allocate no more than 2% of your total portfolio toward this LEAPS position
- Understand that options can expire worthless
- Be aware that improper sizing can lead to significant losses
- Consult a licensed financial professional before trading
Neither the author nor publisher is liable for financial losses incurred from attempting to follow this analysis.
Final Summary
TTD is deeply oversold across multiple timeframes but maintains strong financial fundamentals, supportive insider behavior, stable news flow, and meaningful analyst targets. Combined with a powerful post-drop technical setup, the 2027 $35 LEAPS call provides excellent risk-adjusted exposure to a multi-month rebound.