
Ticker: IBM (NYSE: IBM)
Current Price (at analysis): ~$239
International Business Machines Corporation (IBM) has pulled back sharply from recent highs, creating what may be a calculated opportunity for a long-dated, in-the-money (ITM) LEAPS call strategy. After reviewing the technical charts, financials, analyst price targets, insider activity, and options flow, we can now evaluate whether IBM stock presents a favorable risk-adjusted setup.
📊 Technical Analysis – 3M, 1Y, and 5Y Charts
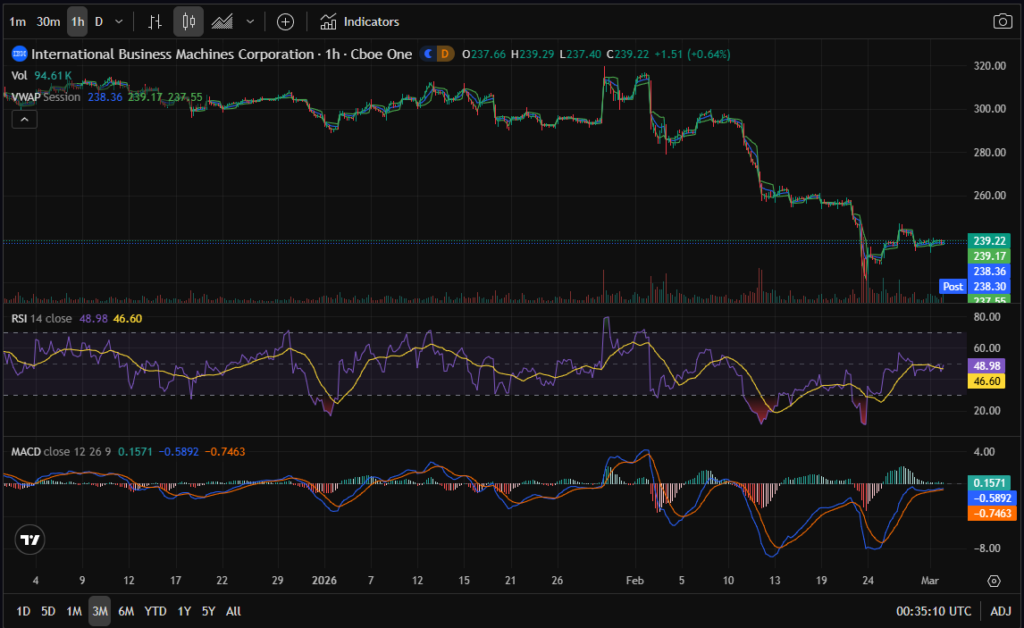
On the 3-month chart, IBM recently printed a short-term low following a roughly 20–22% pullback from the $300+ region. RSI had dipped into oversold territory and is now stabilizing near neutral. A bullish MACD crossover is beginning to form on lower timeframes, signaling early reversal potential.
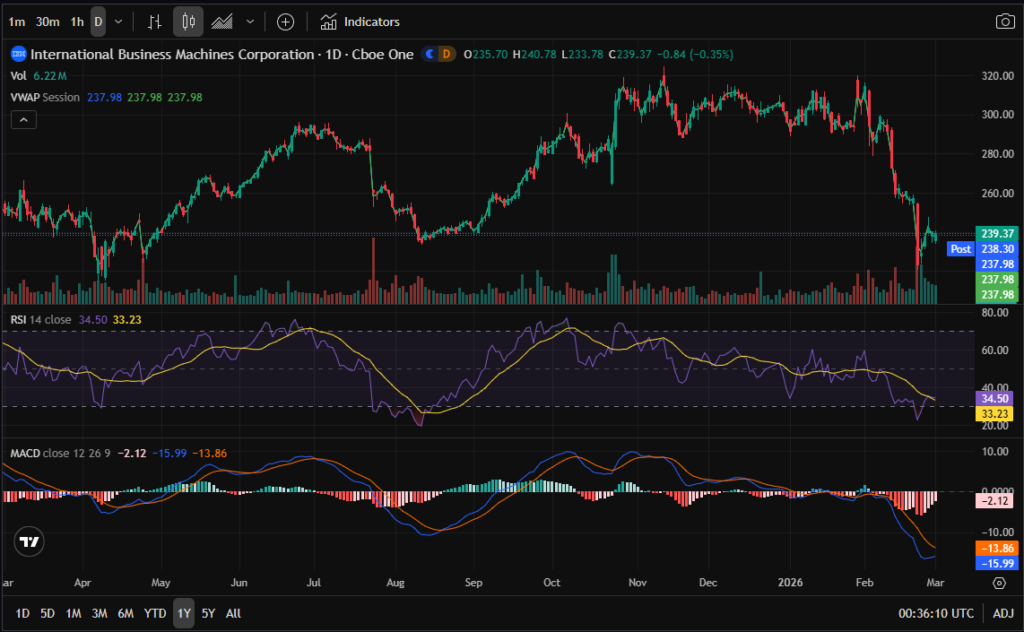
On the 1-year chart, IBM is near a major support zone around $235–240. Daily RSI is hovering in the mid-30s, suggesting the stock is close to oversold levels. However, weekly momentum indicators remain cautious, meaning this is an early-stage stabilization, not a confirmed multi-year bottom.
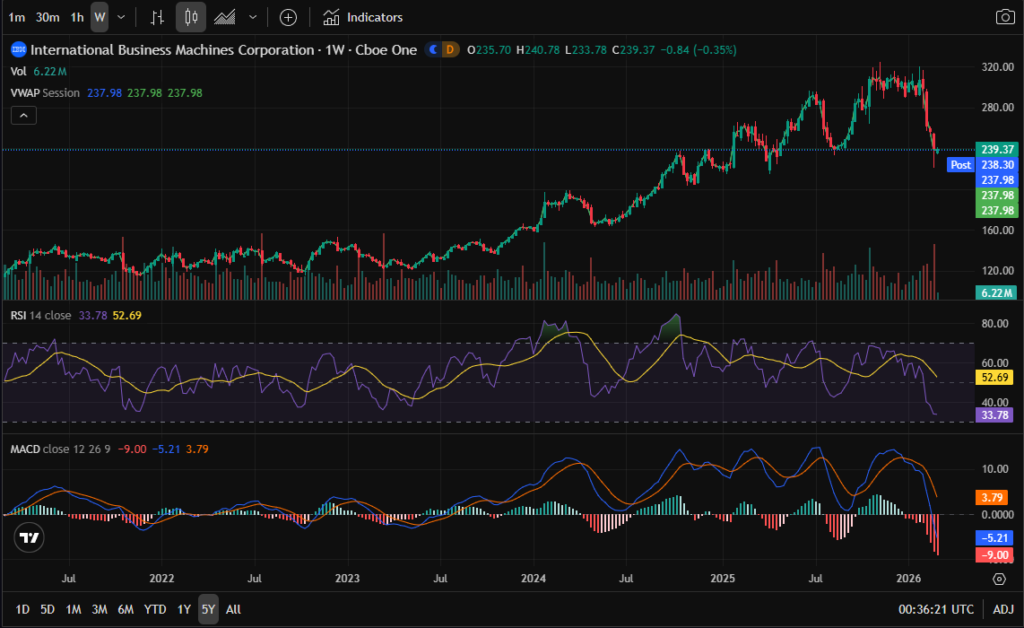
The 5-year chart shows IBM remains within a broader structural uptrend that began in 2022. The recent selloff appears to be a sharp correction within that longer-term trend rather than a structural breakdown.
Technical Conclusion: IBM is attempting to stabilize at major support. Confirmation is still developing, but the risk-reward profile is improving.
💰 Financial Analysis – Strong Cash Flow Foundation
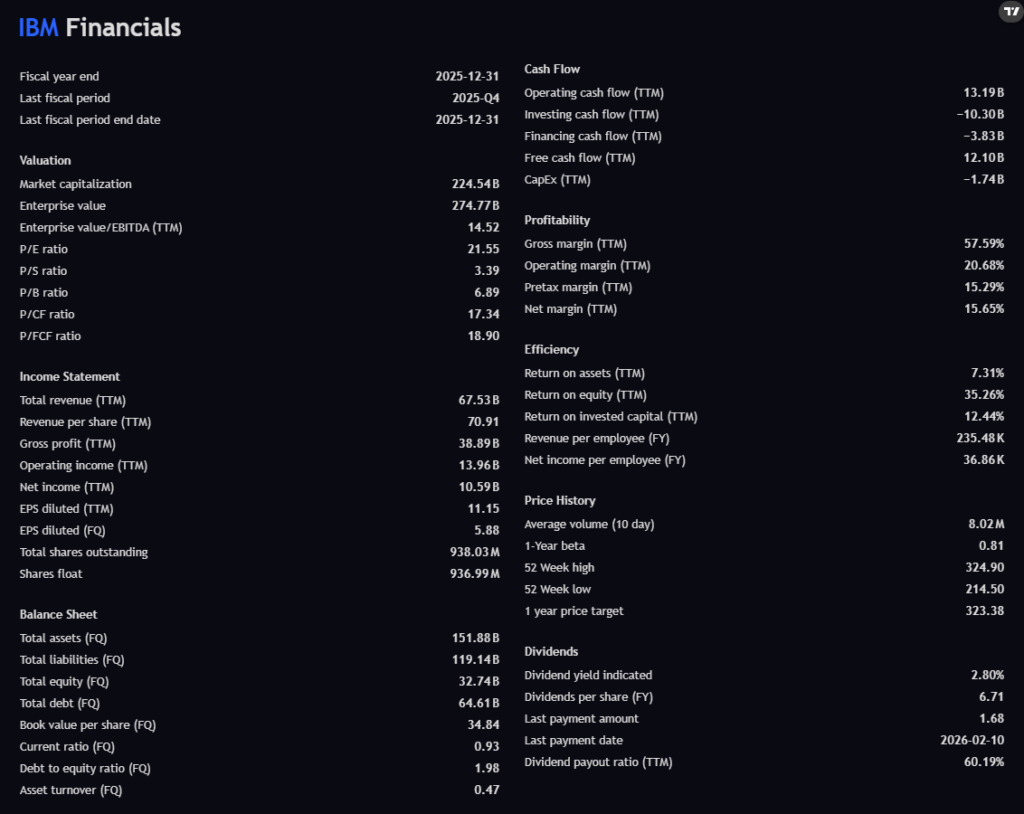
IBM’s financials remain a core pillar of the bullish thesis:
- Free Cash Flow (TTM): ~$12.1B
- Operating Cash Flow: ~$13.2B
- Gross Margin: ~57%
- Operating Margin: ~20%
- Net Margin: ~15%
- ROE: ~35%
- Debt-to-Equity: ~1.98
IBM generates consistent, substantial free cash flow. CapEx remains manageable, and margins are strong for a legacy enterprise technology company. While leverage is elevated, cash generation comfortably supports debt servicing.
This is not a distressed balance sheet scenario. Instead, IBM represents a stable, cash-rich enterprise tech platform with recurring revenue streams and mission-critical infrastructure exposure.
📰 News Sentiment – AI Disruption Narrative

Recent headlines highlight concerns about AI disruption from companies like Anthropic. Media narratives suggest IBM could face pressure from next-generation AI competitors.
However, IBM operates in enterprise AI integration, hybrid cloud, consulting, and regulated-industry infrastructure. It is not directly competing with AI model labs. The selloff appears narrative-driven rather than cash-flow-driven.
Historically, narrative fear combined with strong fundamentals can create favorable entry points.
📈 Analyst Price Targets – Significant Upside Gap
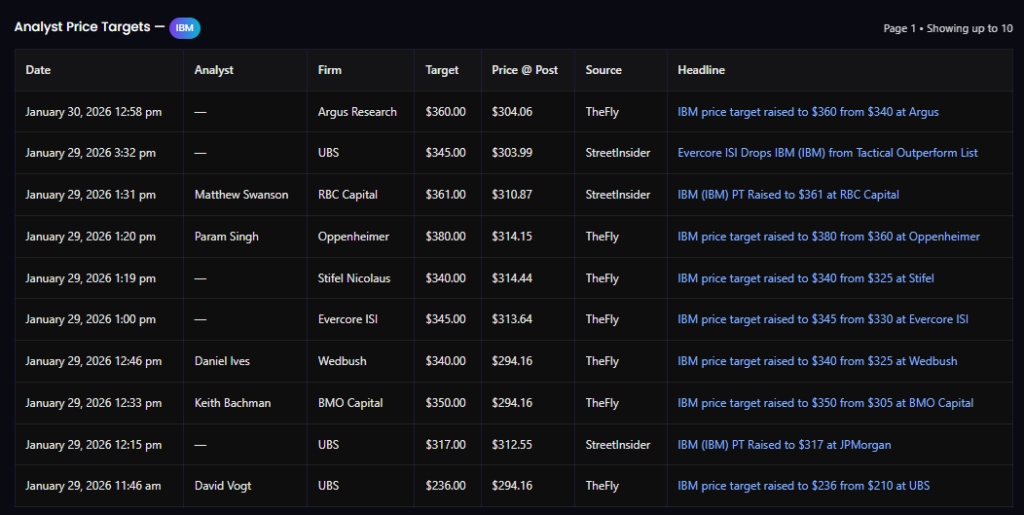
Recent analyst targets range from $317 to $380, with a clustering around $345–355.
At ~$239, that implies:
- Conservative upside to $317 → ~32%
- Average target ~$350 → ~46%
While analyst targets can lag price action, the current gap between price and consensus target suggests valuation compression rather than deteriorating fundamentals.
🏛 Insider & Political Trading – Neutral Signal
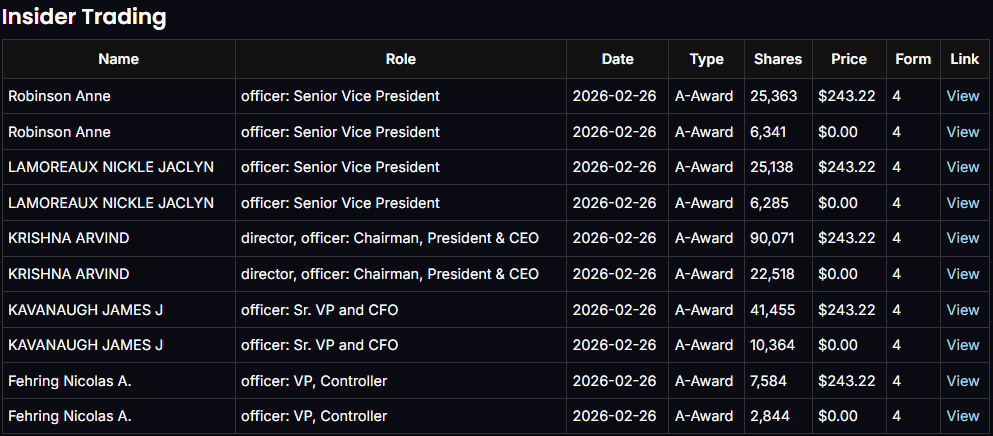
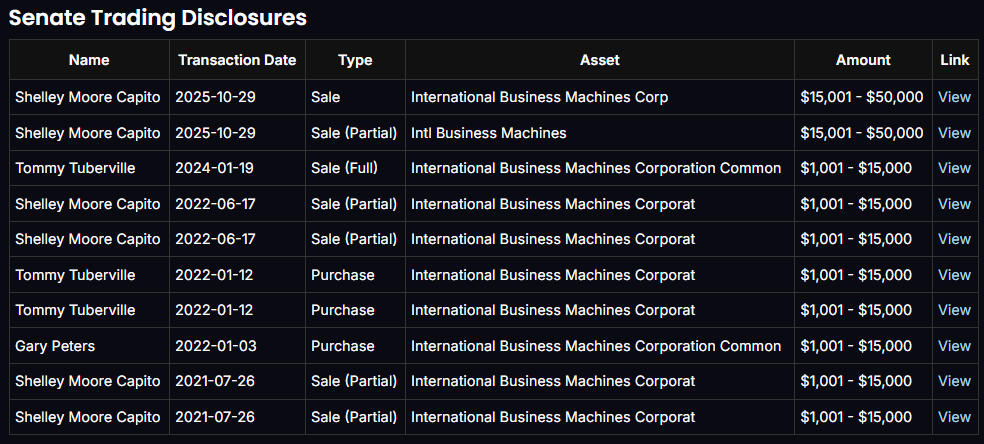
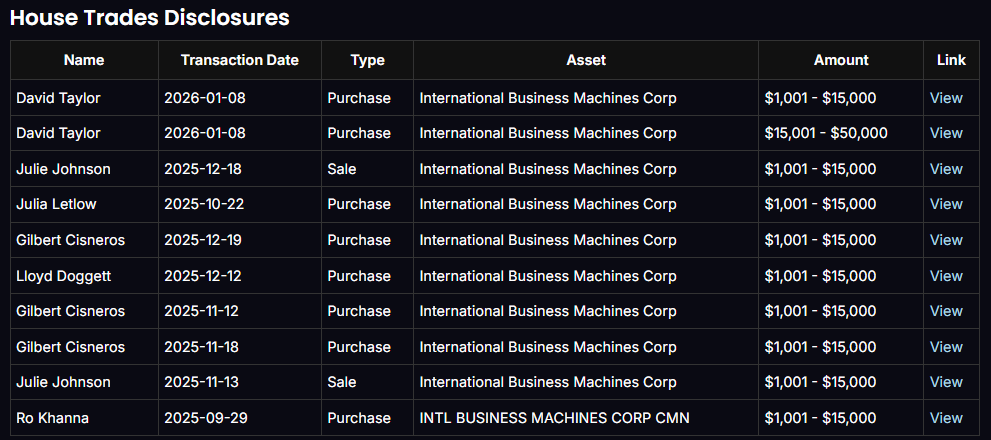
Recent insider transactions were primarily stock awards (A-Award), not open-market purchases. There is no strong insider accumulation signal.
Congressional trades were small and mixed. No aggressive political buying cluster is visible.
This pillar remains neutral. The setup is not insider-driven.
📊 Options Flow Analysis – Bullish Skew
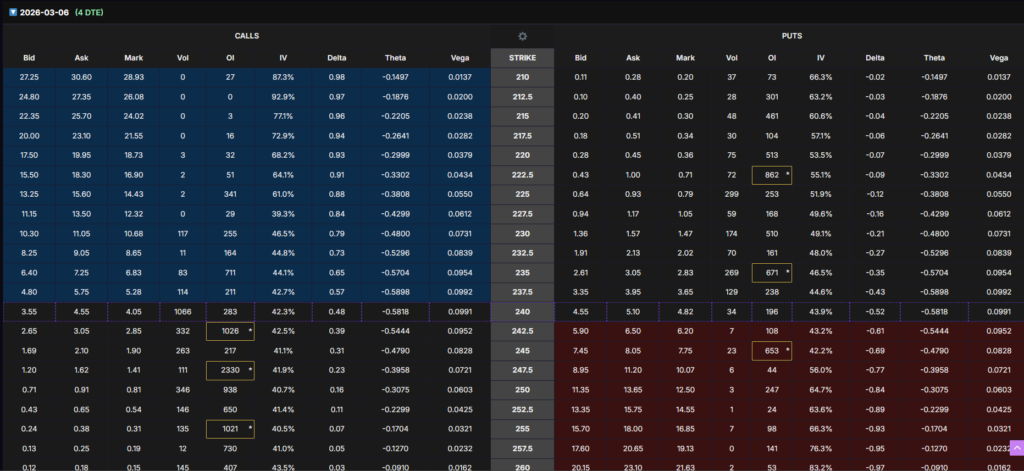
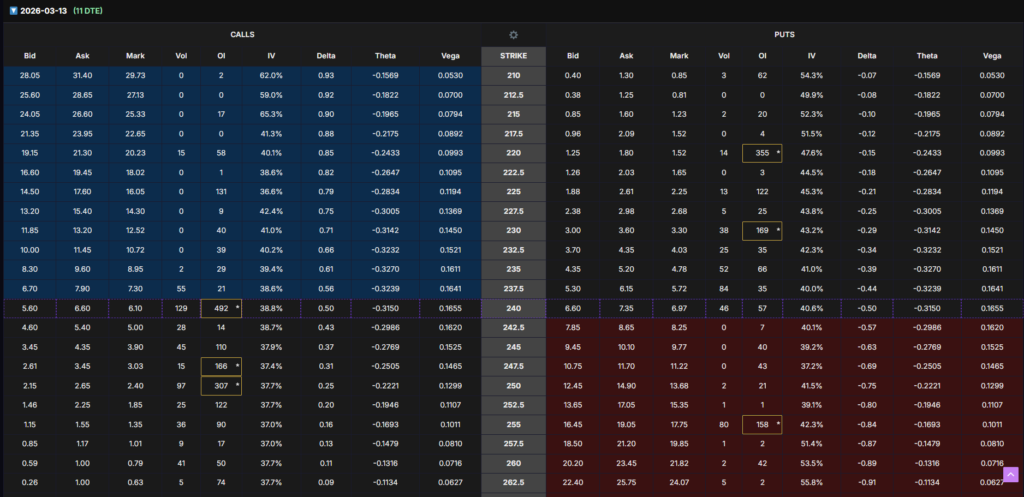
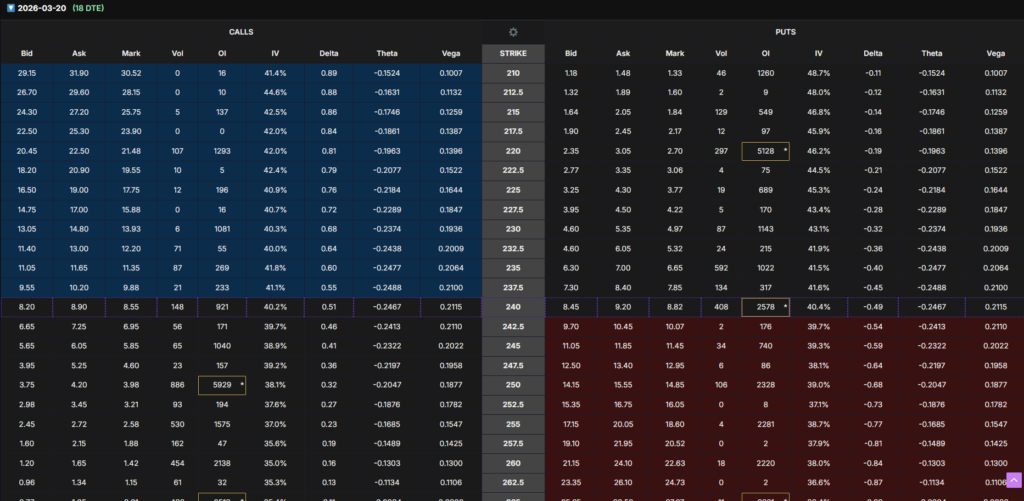
Short-dated options show heavy call open interest above current price, particularly around the $250 strike. This suggests positioning for a rebound toward the $245–250 range.
Put open interest is concentrated near $220, indicating a perceived support floor.
Long-dated June 17, 2027 options show meaningful open interest at the $200 strike, which meets our criteria for liquidity and institutional participation.
🎯 The ITM LEAPS Strategy – June 17, 2027 $200 Call
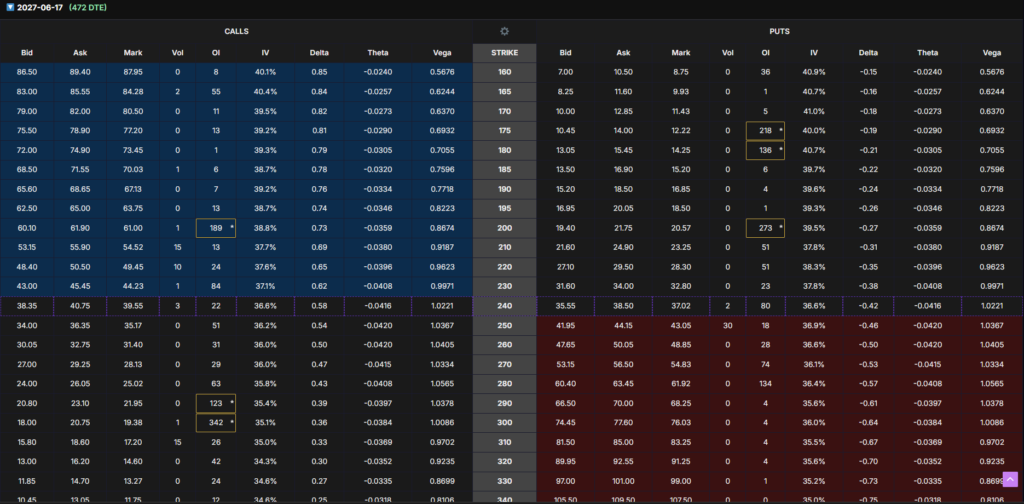
Expiration: June 17, 2027 (~472 DTE)
Strike: $200
Delta: ~0.73
Premium: ~$61
Breakeven: ~$261
This structure provides:
- Strong participation (73 delta behaves like 73 shares)
- Manageable time decay
- Significant intrinsic value cushion
- Defined risk vs stock ownership
If IBM trades to:
- $290 → ~47% option gain
- $300 → ~60–65% gain
- $310 → ~75–85% gain
The most probable 12–18 month range based on fundamentals and analyst targets is $285–305.
📌 Expected Profit Target & Exit Plan
A disciplined profit target:
Primary Target: 60–80% gain on option premium
Likely stock price range to trigger exit:
$295–$310
Suggested approach:
- Trim 50% near $295–300
- Exit remainder near $305–315
This strategy prioritizes controlled, asymmetric returns over speculative upside.
🔎 Final Thesis on IBM Stock
IBM is not a high-growth momentum trade. It is a high-quality, cash-flow-backed enterprise technology company undergoing a correction within a broader structural trend.
Strengths:
✔ Strong free cash flow
✔ Analyst upside gap
✔ Supportive options structure
✔ Reasonable valuation
Risks:
⚠ No insider accumulation
⚠ Weekly momentum not fully reversed
⚠ AI narrative volatility
Overall, IBM qualifies as a disciplined ITM LEAPS candidate rather than an aggressive speculative play.
⚠️ Disclaimer
This article is for informational and educational purposes only and does not constitute financial, investment, or legal advice. Options trading involves substantial risk and is not suitable for all investors. The analysis presented reflects opinion based on publicly available data at the time of writing. No position is currently held. Always conduct your own due diligence and consult with a licensed financial professional before making investment decisions.