📊 Technical Overview
Harmony Biosciences (NASDAQ: HRMY) has faced one of its sharpest corrections in recent history. The stock collapsed from the mid-$30s into the $26–27 range, marking a new one-year low and testing multi-year support.
- 3-Month Chart:
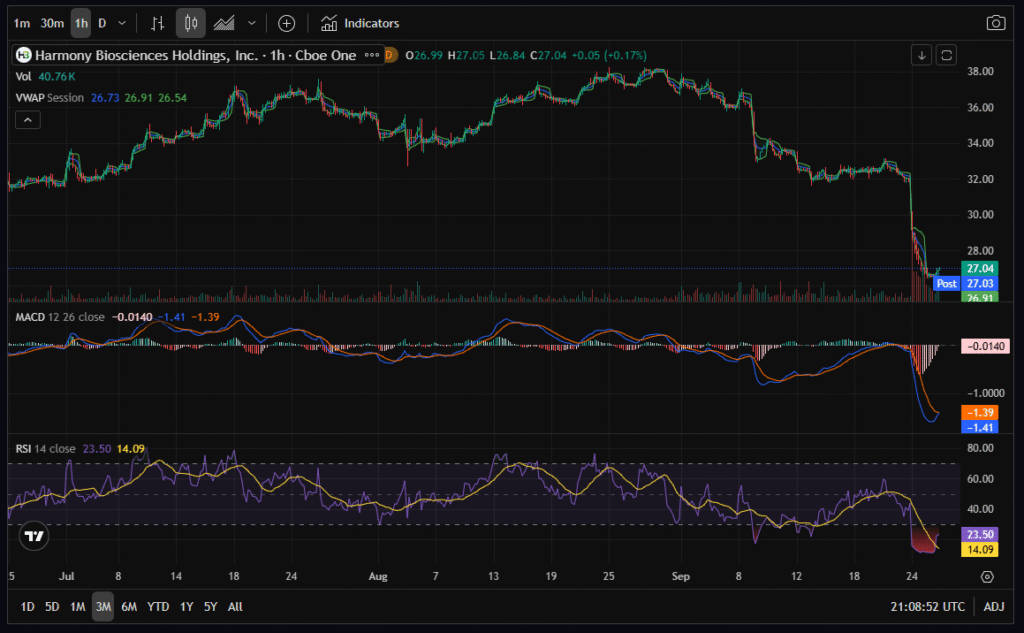
HRMY printed a steep breakdown with a 3-month low near $26.84. The RSI plunged to oversold levels (23.50), while the MACD bearish crossover is flattening, setting up for a potential bullish reversal. - 1-Year Chart:
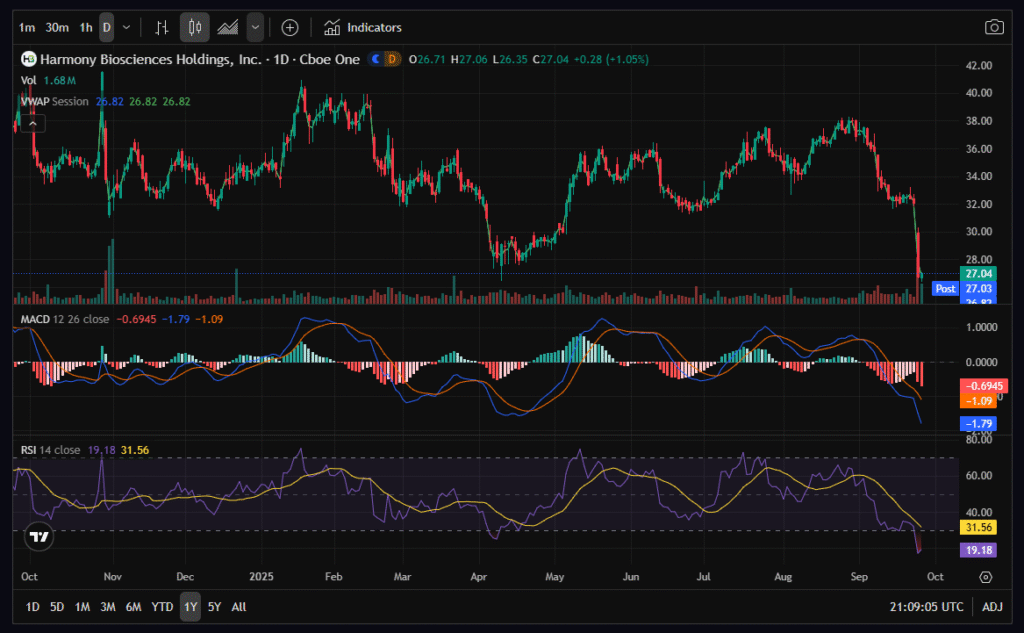
Shares are deeply oversold with RSI at 19.18 and MACD still negative. Volume spiked heavily on the selloff, confirming institutional selling. - 5-Year Chart:
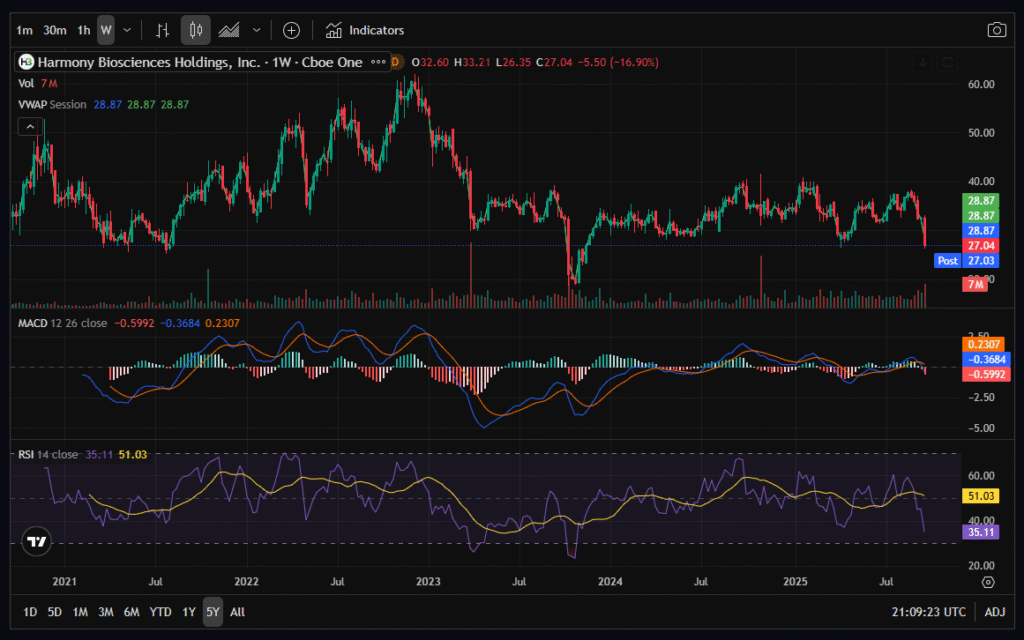
Price is holding long-term support around $25–27. Historically, this level has acted as a base for reversals. MACD has turned bearish on the weekly, but RSI at 35.11 suggests we’re entering undervalued territory.
Takeaway: Technically oversold in the short and medium term, HRMY sits at a make-or-break support zone.
💰 Fundamental Strength
Despite pipeline disappointment, HRMY’s core fundamentals remain robust:
- Revenue (TTM): $772.5M
- Gross Margin: 75.25%
- Net Margin: 23.42%
- Free Cash Flow: $258.7M (strong positive)
- Debt-to-Equity Ratio: 0.27 (low leverage)
- ROE: 27.58% | ROIC: 22.09%
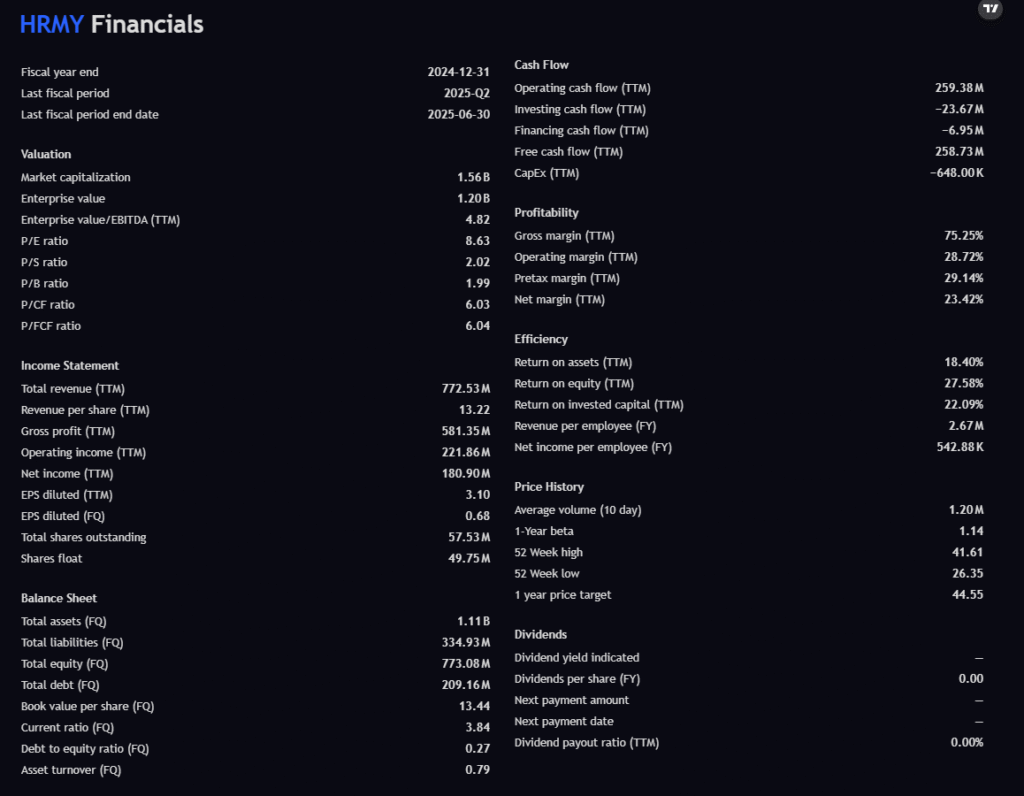
HRMY is profitable, cash-generating, and undervalued with a P/E ratio of just 8.63 and P/FCF of 6.04 — multiples far below biotech peers.
📰 Latest News & Catalyst
The recent selloff was triggered by Phase 3 failure of ZYN002 (Fragile X Syndrome). Headlines confirm the experimental drug did not meet its primary endpoint, leading to a sharp institutional exit.
- Zacks: “HRMY Stock Down as Fragile X Syndrome Study Fails to Meet Goal”
- Reuters: “Experimental drug fails late-stage trial”
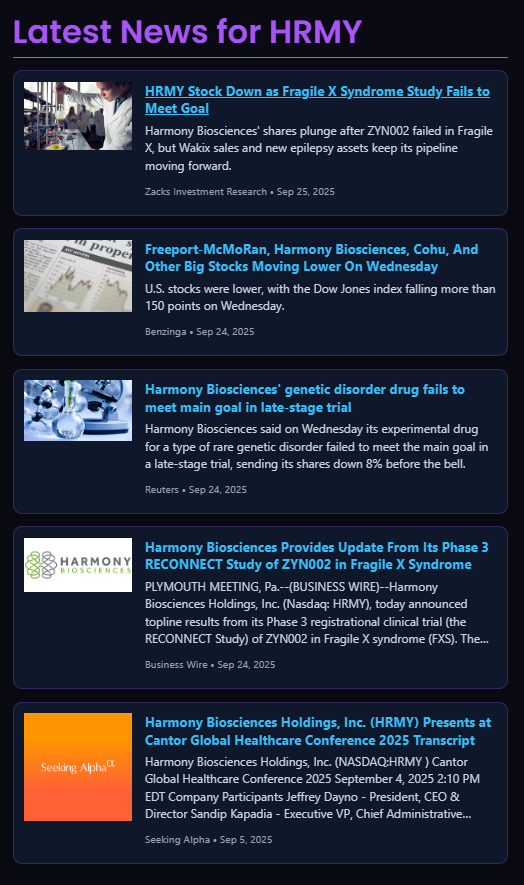
Despite this setback, HRMY’s core Wakix (pitolisant) franchise remains strong, keeping revenues stable. Earnings in one month will serve as the next major volatility driver.
📈 Analyst Targets
- Bearish Outlier: Goldman Sachs, $28–33 PT (Neutral rating).
- Consensus Bullish: UBS, Mizuho, Oppenheimer, and Needham see $48–56.
- Most Bullish: Jefferies with a $61 PT.
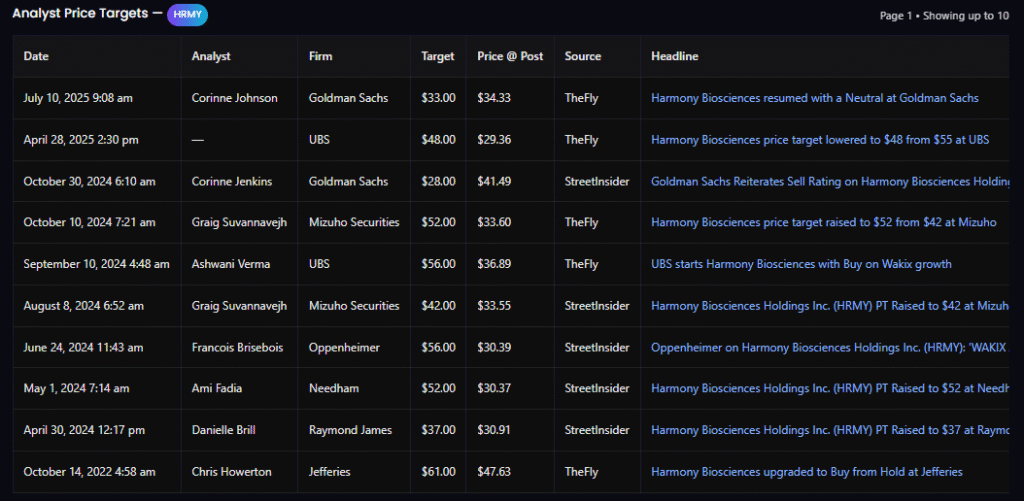
Consensus Price Target: ~$45–48 → Implies ~65–75% upside from current levels.
👔 Insider Activity
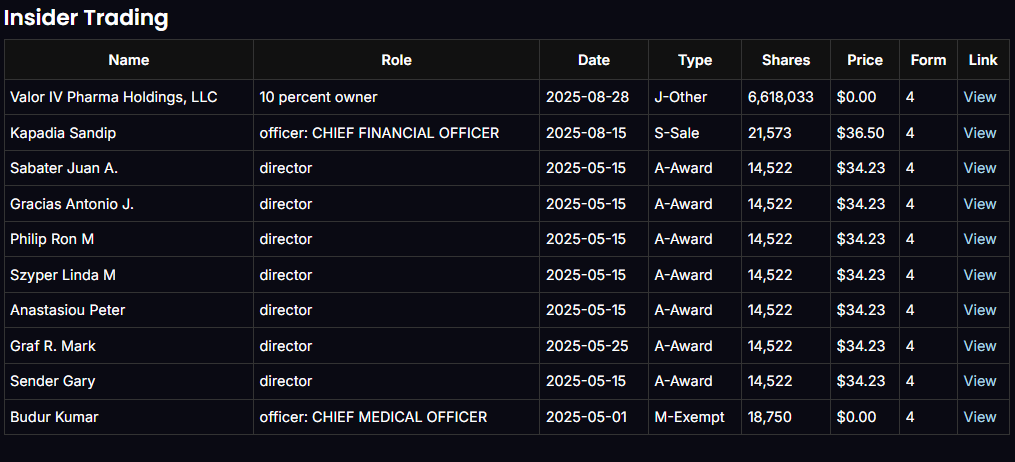
- CFO Sandip Kapadia sold 21,573 shares at $36.50 (May 2025) — notable since this was before the Fragile X news.
- Directors received equity awards at $34.23 — aligning incentives with shareholder value.
- Mixed signals: CFO sale is mildly bearish, but overall insider alignment remains strong.
(Insert Insider Trading Image Here)
🔎 Options Flow Analysis
- Oct 2025 Expiration: Largest OI at 35C, 40C, 50C. Most meaningful bullish positioning at 35C.
- Jan 2026 Expiration: OI concentrated at 35C & 37.5C, confirming bullish speculation on recovery into mid-$30s.
- Apr 2026 Expiration (204 DTE): Strongest call-side OI at 35C (117 contracts) with highest Vega sensitivity.
Conclusion: Flow suggests bullish speculation into $35–37.5, with traders leveraging volatility into earnings.
🔎 Options Flow Analysis (Call Side)
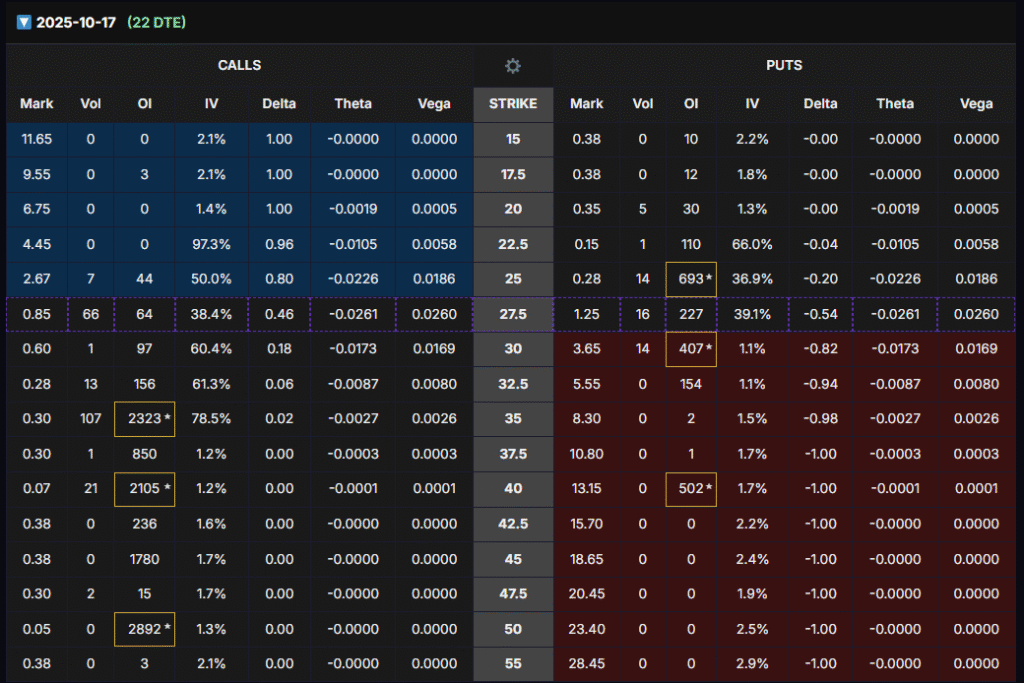
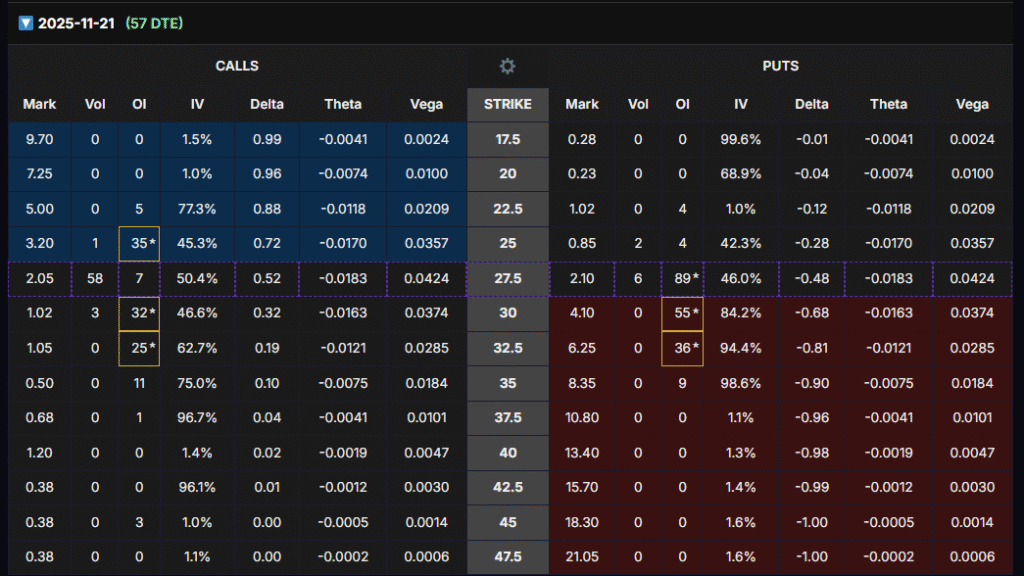
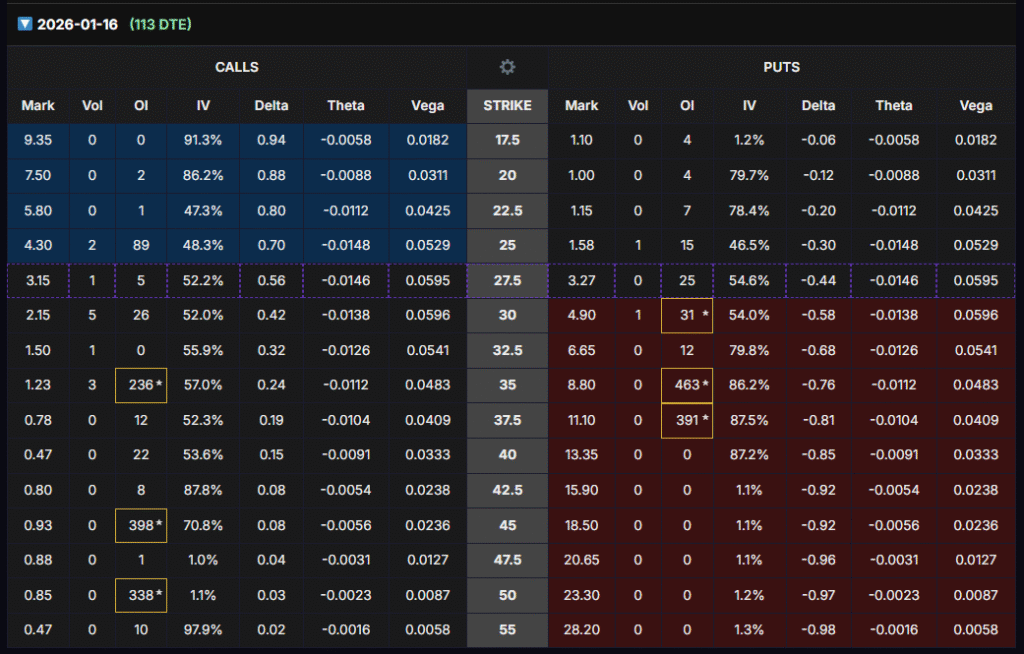
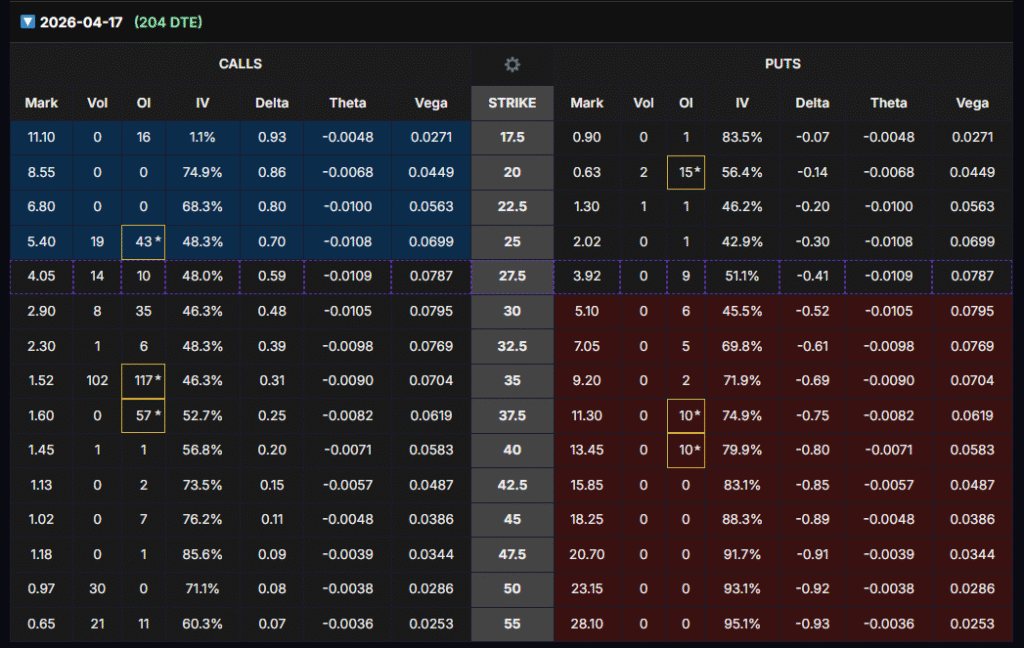
1) Oct 17, 2025 (22 DTE)
- Largest call OI clusters: 50C (OI ~2,892), 35C (OI ~2,323), 40C (OI ~2,105); secondary pockets at 37.5C (OI ~850) and 30–32.5C (OI ~97–156).
- Read: Concentration above spot (stock ~$27) and especially around $35 suggests rebound speculation into the low–mid 30s. The very far-OTM 40–50C stacks look like lotto/hedge/covered-call interplay, not pure conviction.
Verdict: Bullish-leaning for a bounce toward $30–35 near term; far-OTM stacks are lower-quality signals.
2) Nov 21, 2025 (57 DTE)
- Largest call OI: 25C (OI ~35), 30C (OI ~32), 32.5C (OI ~25); 27.5C (OI ~7). Overall participation is light.
- Read: Modest but constructive interest sits ATM to slightly OTM, which aligns with a gradual recovery thesis rather than a moonshot.
Verdict: Neutral → mildly bullish; depth is thin, so October’s near-term flow is the truer tell.
3) Jan 16, 2026 (113 DTE)
- Largest call OI: 47.5C (OI ~398), 50C (OI ~338), 35C (OI ~236); smaller at 37.5C (OI ~12) and 40C (OI ~22).
- Read: This is where medium-term positioning shows up. The 35C build is the most credible bullish signal, targeting a move back into the mid-30s within 3–4 months. The big 47.5–50C stacks again look like low-delta speculation/hedges.
Verdict: Bullish medium-term, anchored by 35C accumulation.
4) Apr 17, 2026 (204 DTE) — our LEAPS board
- Largest call OI near tradable strikes: 35C (OI ~117) and 37.5C (OI ~57); additional interest at 25C (OI ~43) and 30C (OI ~35).
- Greeks worth noting: 35C carries Δ ~0.31 with high Vega, ideal for IV expansion into the upcoming earnings window.
Verdict: Bullish setup skewed to $35–$37.5; the 35C is the cleanest balance of liquidity, delta, and vega for our plan.
📌 Flow Synthesis
- Repeated 35C call interest across expirations (Oct, Jan, Apr) = most reliable bullish tell for a rebound path into the mid-30s.
- Very large far-OTM (40–50C) OI likely includes hedging/covered calls/lotto and is lower signal quality.
- For our vega-driven LEAPS approach, Apr 2026 35C matches the flow and gives max IV sensitivity into earnings.
Flow Verdict: Bullish-leaning with the $35 strike as the recurring focal point. This aligns with our Batch-2 entry on Apr 2026 $35C to monetize IV/Vega ramp into earnings, with delta kicker if price mean-reverts toward $30–35.
🎯 LEAPS Strategy Setup
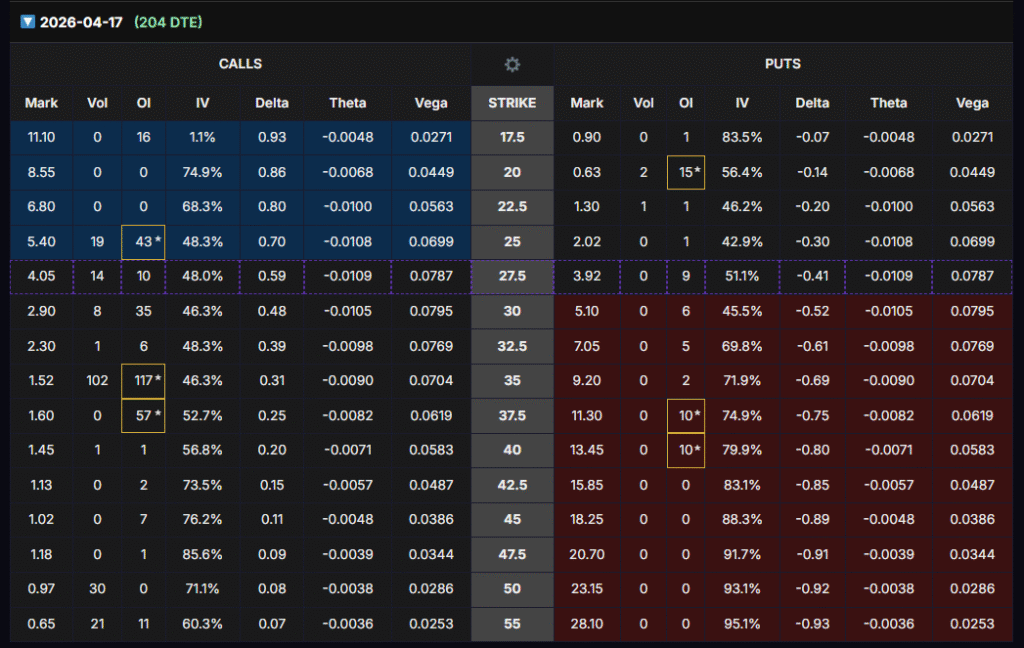
We will use the Apr 2026 $27.5 Calls (204 DTE) for our structured entry:
- Delta: ~0.59 → provides stronger responsiveness to stock moves, giving nearly 1:1 exposure without needing the stock to rally deep OTM.
- Vega: ~0.0787 → still highly sensitive to volatility expansion, making this contract ideal for earnings IV ramp.
- OI: Growing interest at this strike, ensuring liquidity.
Catalyst Play: Entering now allows us to benefit from IV/Vega expansion as earnings approach in one month. We plan to close right before earnings to capture volatility premium while avoiding binary event risk.
- Profit Target: At least 80% return (conservative), with potential for 100–110% upside if IV spikes sharply.
- Holding Period: Maximum of 2 months. If profits do not materialize in that window, we will roll over to a new cycle.
📌 Trade Execution Plan – 3 Batch Entry
- Batch 1 – Enter Now: Buy Apr 2026 $27.5C.
- Batch 2 – Enter Later: When the options price drops -40% to -50% of the options price from Batch 1 entry.
- Batch 3 – Enter Later: When the options price drops another -40% to -50% of the options price from Batch 2.
This staged entry allows us to average down into volatility exposure without overcommitting capital upfront, positioning us for maximum IV leverage into earnings.
⚠️ Risk Management & Disclaimer
- Only allocate 2% of total portfolio capital to this trade.
- Exit before earnings to avoid binary FDA/pipeline risks.
- Hold for a maximum of 2 months, then roll over if necessary.
- This analysis is for educational purposes only and not financial advice. Trading options involves substantial risk, including total loss of capital.
✅ Bottom Line: HRMY is a fundamentally undervalued biotech with strong cash flows, oversold technicals, and a major upcoming volatility catalyst. The April 2026 $35C strike offers the best balance of delta and vega exposure for our 3-batch entry strategy, targeting 80–110% gains into earnings.