Ticker: HPQ
Strategy Focus: Long-dated ITM LEAPS Call (718 DTE)
Selected Contract: January 21, 2028 — $15 Call
Executive Summary
HP Inc. (HPQ) is currently trading near multi-year lows, creating a sharp divide between strong underlying cash-flow fundamentals and persistent bearish technical and options-market positioning. While short-term and intermediate signals remain capped by heavy put activity and weak sentiment, long-dated positioning tells a different story: institutional participants appear comfortable owning HPQ over a multi-year horizon, especially through deep in-the-money (ITM) structures that reduce timing risk.
This article breaks down the full decision stack—charts, fundamentals, news, analysts, insider behavior, and options flow—before outlining why a 718 DTE $15 ITM LEAPS call is a rational, risk-defined way to express a long-term thesis without fighting short-term bearish pressure.
Technical Analysis: Multi-Timeframe Context
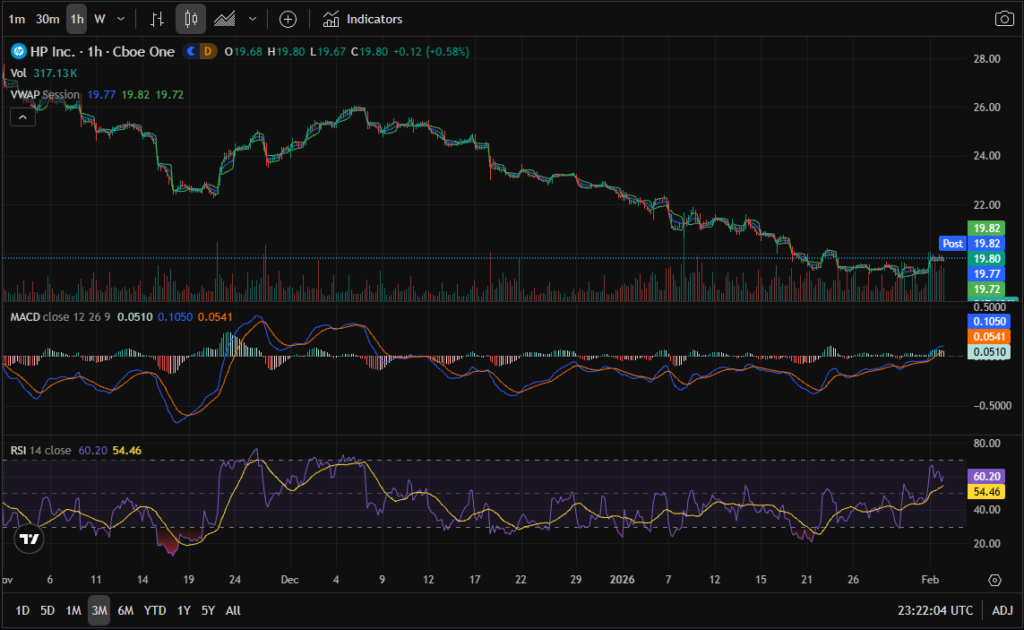
Short-Term (3-Month Chart)
On the 3-month timeframe, HPQ is sitting near a local low after an extended decline. Momentum indicators show:
- Bullish MACD crossover
- RSI elevated relative to price (not oversold)
This suggests a tactical bounce, not a confirmed trend reversal.
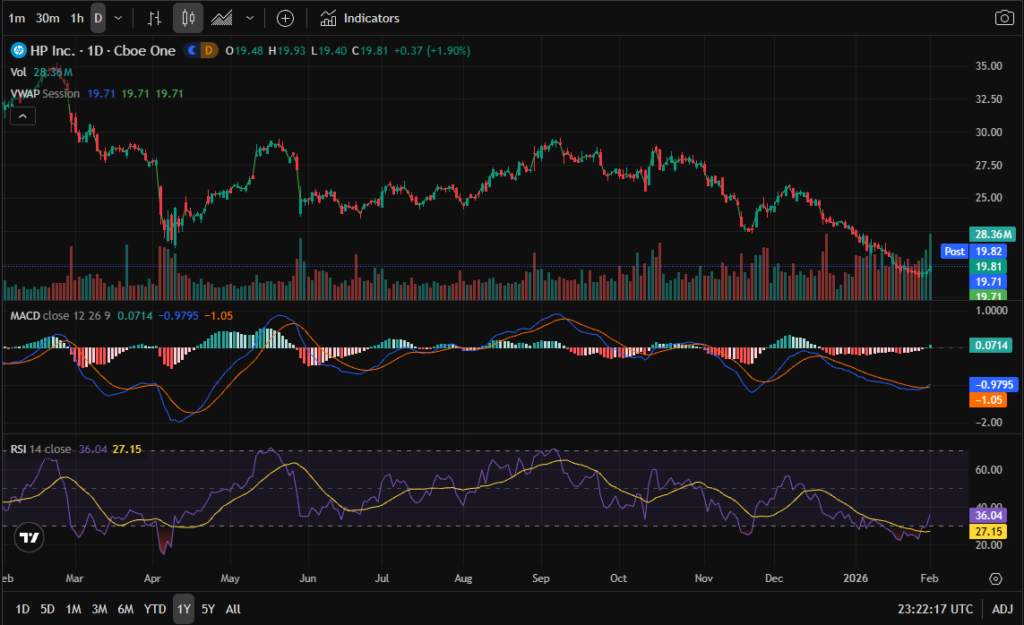
Intermediate-Term (1-Year Chart)
The 1-year chart shows:
- Fresh 1-year lows
- MACD turning upward from deeply negative territory
- RSI normalizing from oversold levels
This is consistent with early base formation, though still unconfirmed.
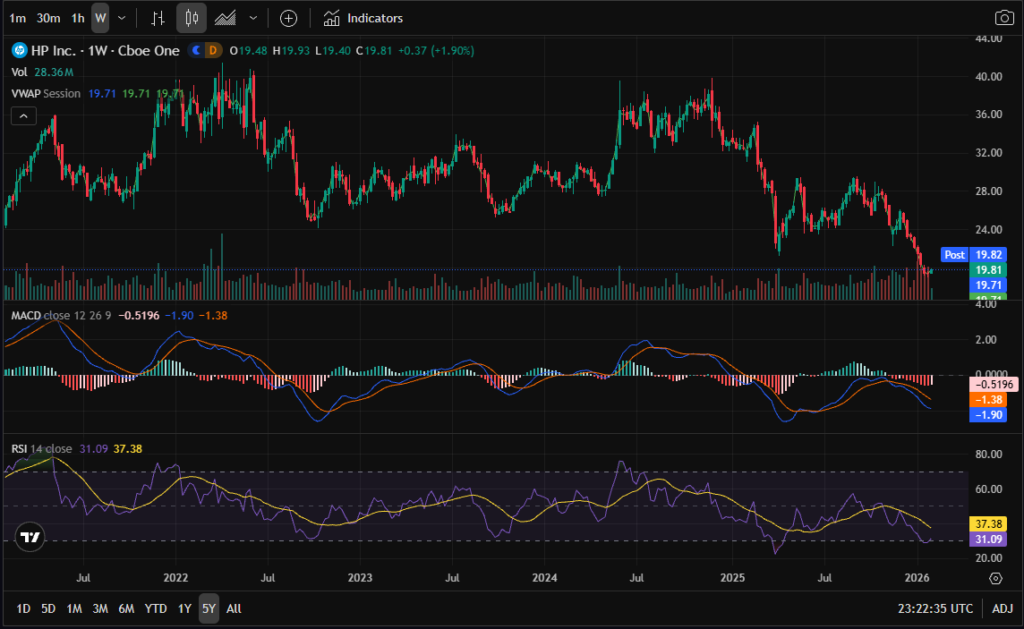
Long-Term (5-Year Chart)
The 5-year view remains structurally bearish:
- Long-term downtrend intact
- Weekly MACD still negative
- RSI neutral, not washed out
This confirms that HPQ is not in a secular uptrend, reinforcing the need for structure-based strategies rather than outright equity conviction.
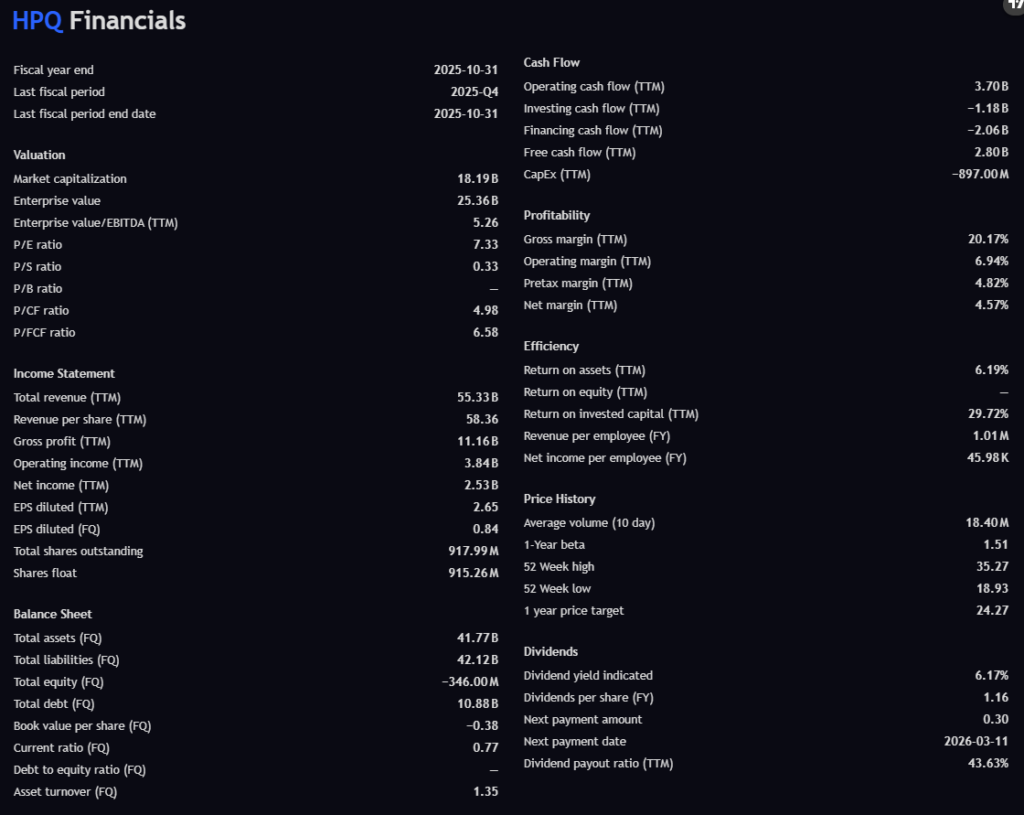
Financials: The Fundamental Floor
Despite weak price action, HPQ’s fundamentals remain robust:
- Free Cash Flow (TTM): ~$2.8B
- Operating Cash Flow (TTM): ~$3.7B
- P/E: ~7x
- EV/EBITDA: ~5x
- Dividend Yield: ~6%
Margins are modest but stable:
- Gross Margin: ~20%
- Operating Margin: ~7%
- Net Margin: ~4.5%
Return on invested capital (ROIC) near 30% highlights efficient capital deployment. Negative equity is largely the result of aggressive buybacks and capital returns, not operational distress.
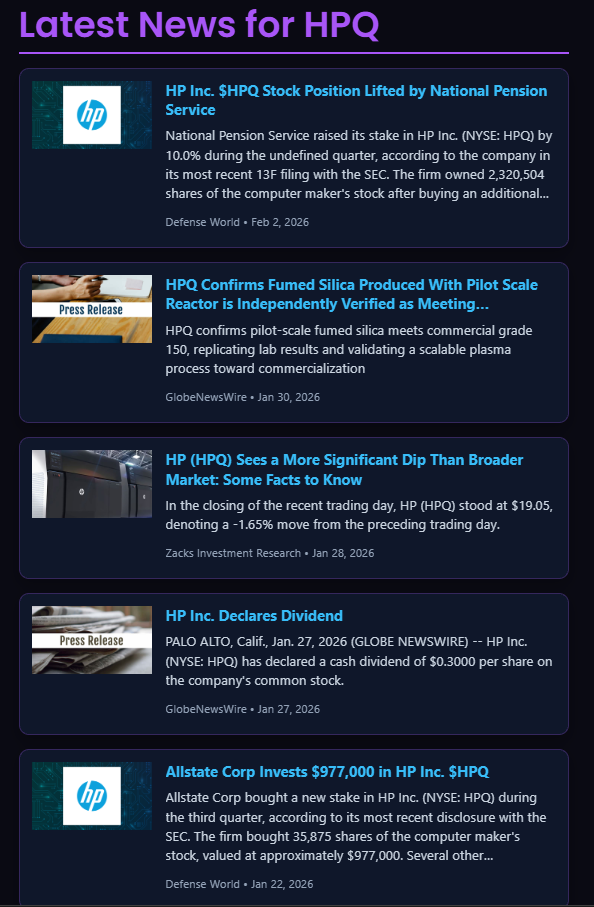
News & Institutional Activity
Recent headlines show:
- National Pension Service increasing its HPQ stake
- Insurance and pension-type buyers adding exposure
- Regular dividend declarations reaffirming cash-flow confidence
These are not growth catalysts, but they do reinforce a downside floor supported by long-duration capital.
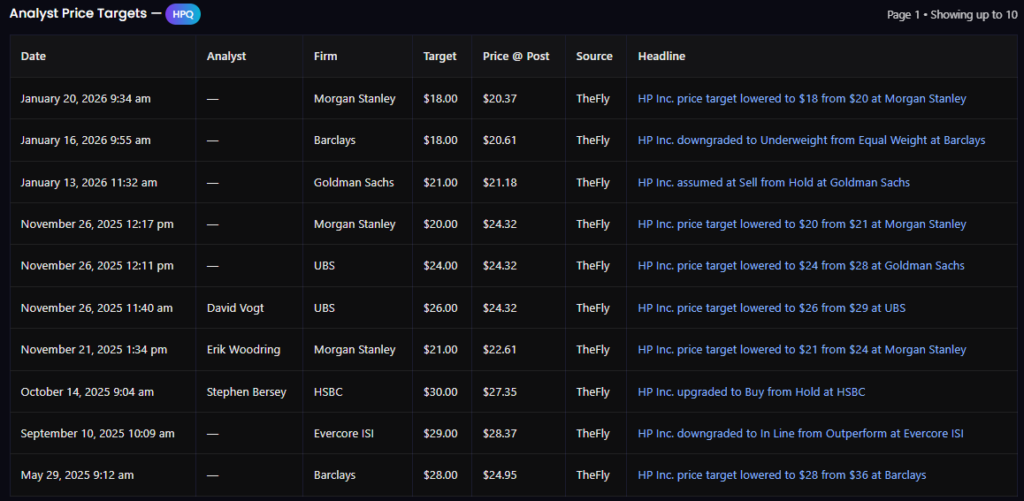
Analyst Price Targets: Capitulation Phase
Recent analyst actions are overwhelmingly reactive:
- Multiple price target cuts
- Several Underweight / Sell ratings
- Targets clustered near $18–24
This compression suggests analysts believe most downside is already realized, but they do not expect growth acceleration. Historically, this environment favors mean reversion, not momentum chasing.
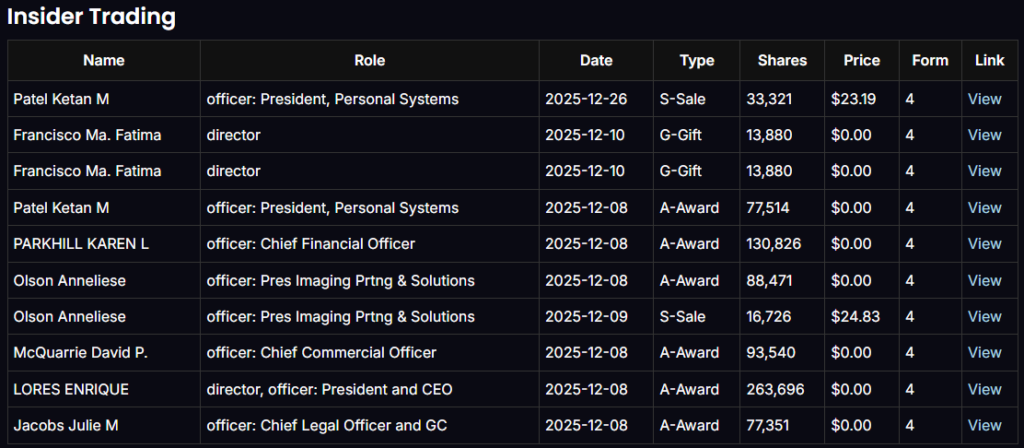
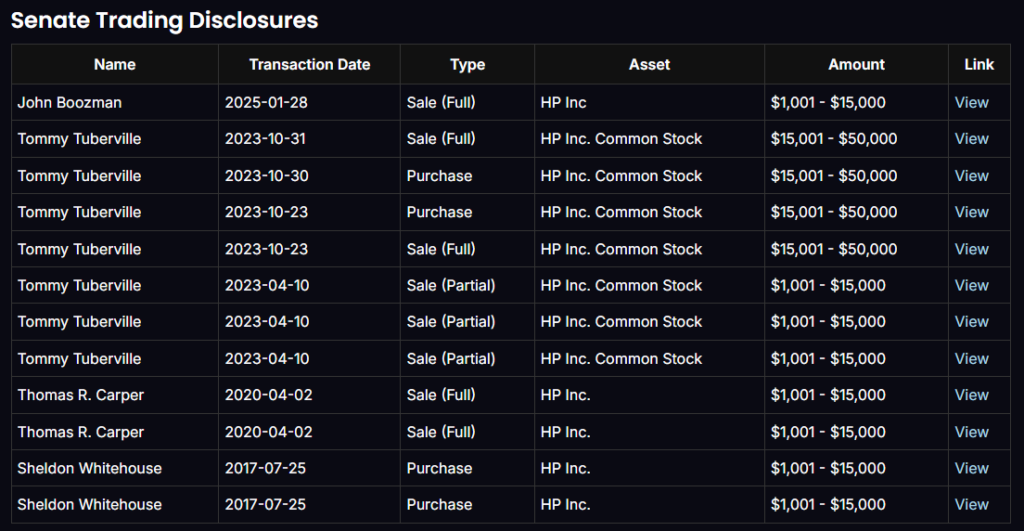
Insider, Senate, and House Trading: No Conviction Signal
A review of insider and political trades shows:
- No meaningful open-market insider buying
- Mostly stock awards, small sales, and routine transactions
- Mixed, low-dollar political trades with no directional consistency
This reinforces a neutral-to-cautious outlook: management does not see imminent upside, but neither are they signaling distress.
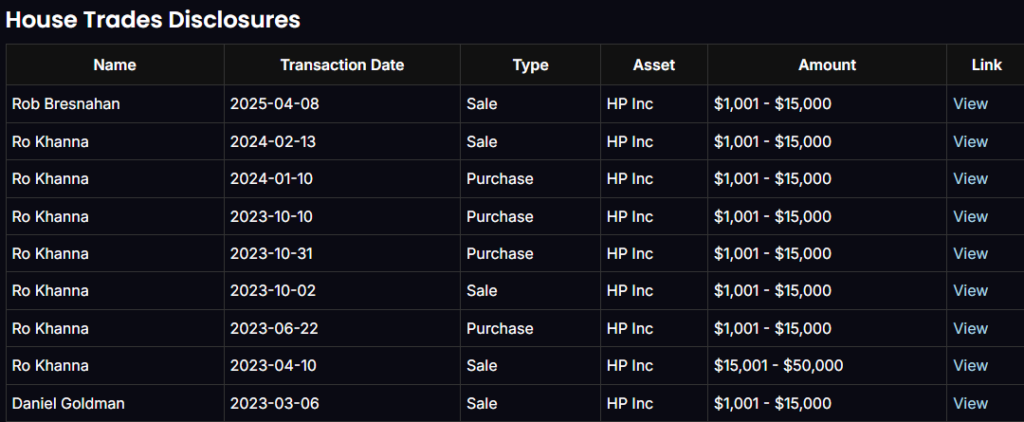
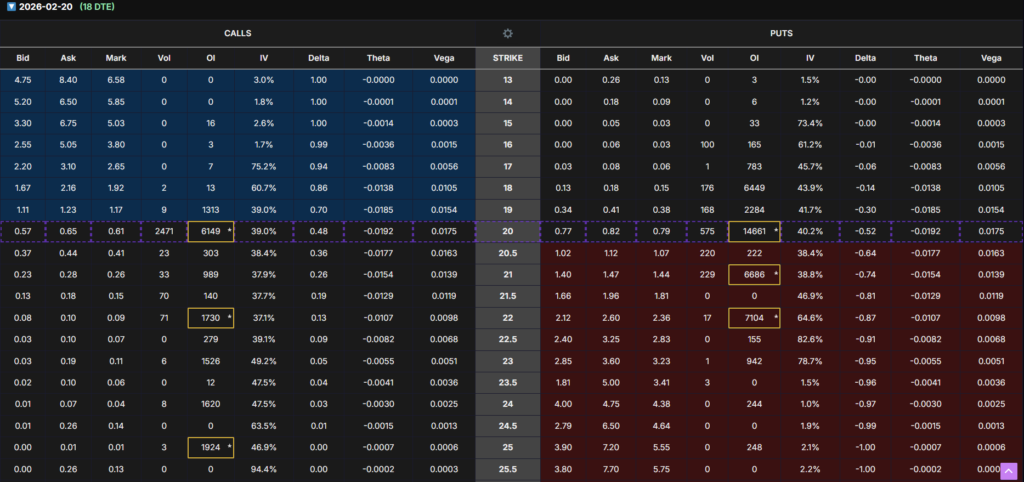
Options Flow Analysis: Short-Term Bearish, Long-Term Strategic
Near-Term Expirations (4–18 DTE)
- Heavy put open interest at $20–22
- Put OI consistently exceeds call OI
- Indicates dealer-controlled, range-bound to bearish price action
Short-term flow is clearly not bullish.
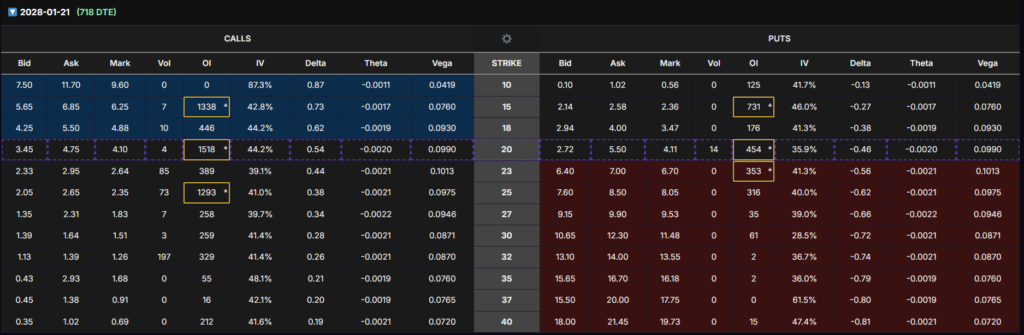
Long-Dated Expiration (718 DTE – Jan 2028)
This is where the thesis changes.
Key observations:
- $15 Call OI ~1,338 contracts
- Delta ~0.73 (deep ITM)
- Substantial OI also at $20 calls
- Long-dated put OI exists, but not overwhelmingly dominant
This suggests long-horizon positioning, not short-term speculation. Participants are willing to commit capital to HPQ two years out, but they are doing so conservatively—via ITM structures with high intrinsic value.
📌 Insert Screenshot: 718 DTE Options Chain Highlighting $15 Call
The ITM LEAPS Strategy: Why $15 Strike, 718 DTE
Contract: January 21, 2028 — $15 Call
Rationale:
- Deep ITM → high delta (~0.70+)
- Lower theta decay relative to ATM calls
- Less sensitivity to near-term volatility
- Aligns with a cash-flow + mean-reversion thesis
This is not a momentum bet. It is a time-arbitrage strategy designed to:
- Survive continued short-term pressure
- Benefit from stabilization, dividends, and valuation normalization
- Avoid repeated timing risk inherent in short-dated calls
Final Synthesis
Putting everything together:
- Technicals: Short-term bounce potential, long-term downtrend intact
- Fundamentals: Strong cash flow, cheap valuation, dividend support
- News: Stabilizing, not catalytic
- Analysts: Capitulated, bearish but late
- Insiders: Neutral, no conviction buys
- Options Flow: Short-term bearish, long-dated strategic positioning
Conclusion
HPQ is not a breakout stock. It is a cash-flow-backed, institutionally tolerated value name. For that reason, a 718 DTE $15 ITM LEAPS call offers a cleaner risk-reward profile than common stock or short-dated options, allowing time to work while respecting the market’s ongoing skepticism.
Disclaimer
This article is for educational and informational purposes only and does not constitute financial advice, investment recommendations, or a solicitation to buy or sell securities or options. Options trading involves risk, including the potential loss of principal. Past performance is not indicative of future results. Always conduct your own research and consult with a licensed financial professional before making investment decisions. The author holds no obligation to update this analysis as market conditions change.