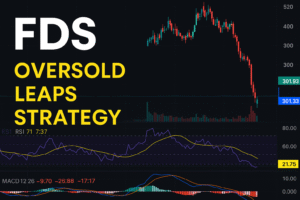
🧐 Company & Market Context
FactSet Research Systems (NYSE: FDS) is a leading financial data and analytics provider, often compared with Bloomberg and Refinitiv. The company has a strong moat, sticky subscription-based revenues, and high free cash flow margins. However, recent earnings results (Q4 2025) disappointed the market, with EPS missing consensus despite revenue growth of +6.2% YoY. This triggered a sharp selloff, sending the stock down ~17% in one week and to five-year lows near $301.
📊 Technical Analysis
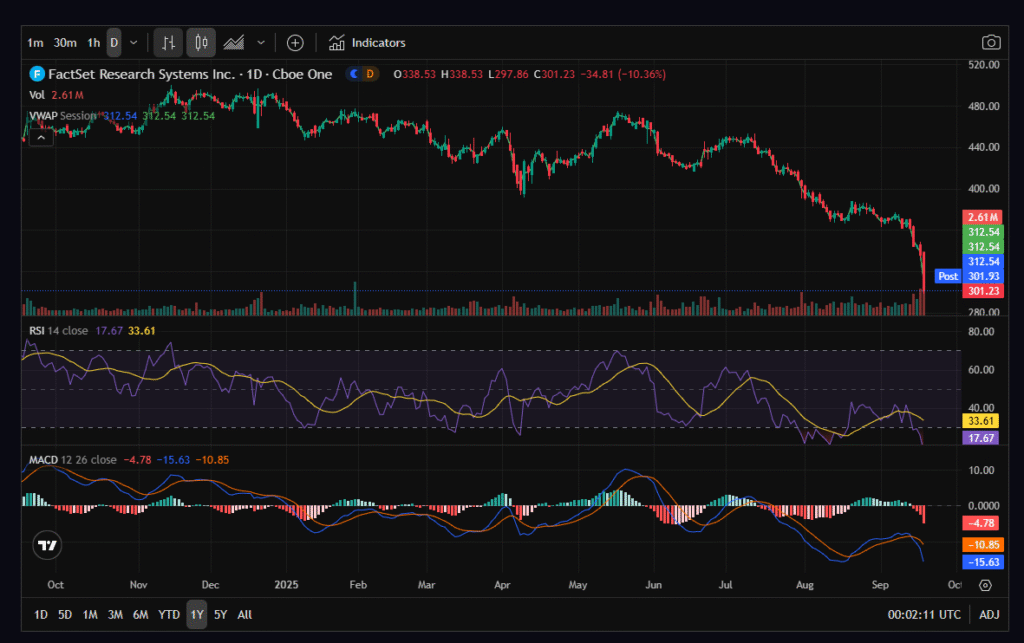
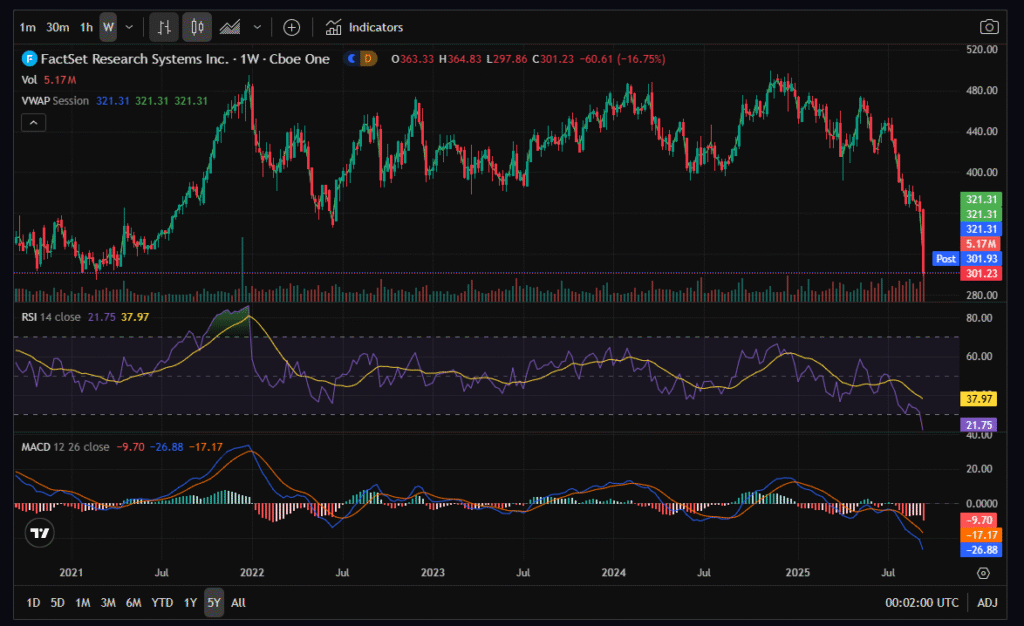
Weekly & Daily Charts (2021–2025):
- Price at multi-year lows, breaking below $320–330 support.
- RSI (5 year chart ~21, 1 year chart ~17): Deeply oversold, suggesting potential for a short-term rebound.
- MACD: Bearish crossover on both 1 year and 5 year charts, confirming negative momentum.
- Volume: Heavy selloff volume confirms capitulation, often a precursor to a bounce.
Support & Resistance:
- Support: $300 (psychological), then $280 (2020 pre-COVID breakout zone).
- Resistance: $330 (old support, now resistance), $360–370 gap-fill.
👉 Setup: Technically oversold, likely to see a relief rally, but trend remains bearish until price reclaims $330+.
💰 Financial Analysis (12-Pillar Framework Highlights)
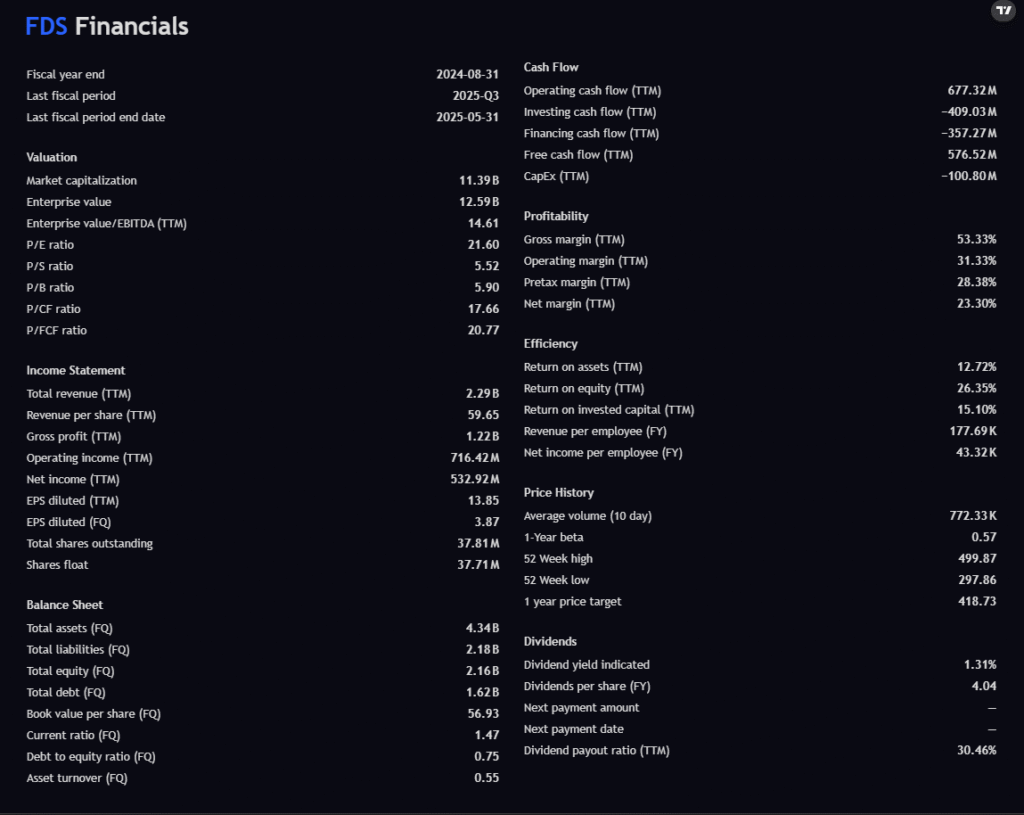
- Revenue (TTM): $2.29B (+6.2% YoY) → steady but not hyper-growth.
- EPS (TTM): $13.85, Net Income $533M → profitable but missed estimates.
- Free Cash Flow: $576M (≈25% margin) → strong cash generation.
- Margins: Gross 53%, Operating 31%, Net 23% → very healthy.
- ROE: 26% | ROIC: 15% → capital efficient, hedge-fund attractive.
- Debt/Equity: 0.75 → manageable leverage.
👉 Fundamentally solid with wide margins and cash flow strength, but valuation (~21x P/E) looks rich for mid-single digit growth.
📰 Recent Earnings & News

- Q4 2025 EPS missed consensus ($4.05 vs $4.15).
- Revenue rose +6.2% YoY, showing resilience but slower-than-expected growth.
- Market reaction: –17% weekly decline, worst selloff in 5 years.
- Guidance cautious → sparked valuation reset.
📉 Analyst Price Targets
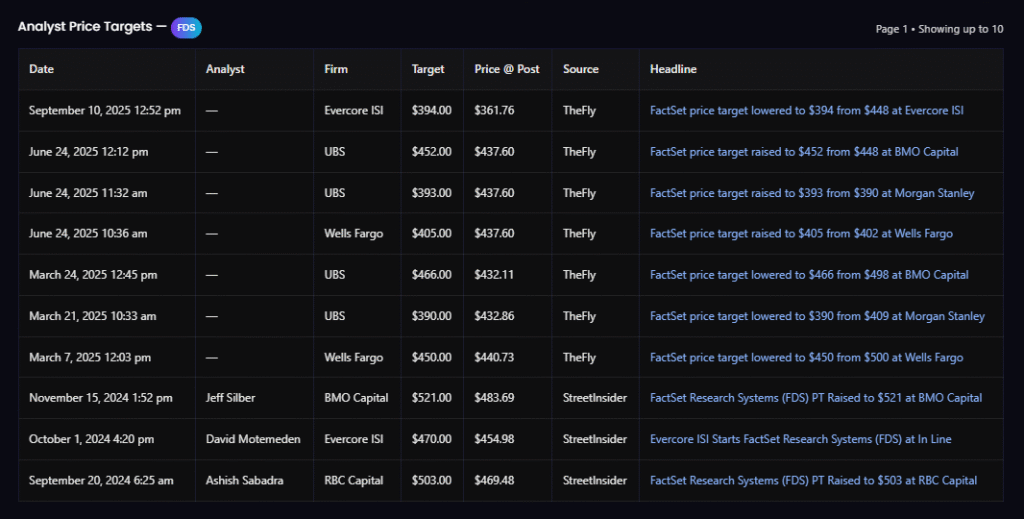
Recent revisions show a clear downtrend in expectations:
- Evercore ISI (Sept 10, 2025): Cut PT to $394 from $448.
- UBS, Wells Fargo (Mar–Jun 2025): Lowered PTs to $390–$452.
- BMO/RBC (2024): Bullish targets $500–520, but now outdated.
Consensus range: $390–$450 → still 30–50% upside from current $301, but targets are falling steadily.
🏛 Insider & Political Trading
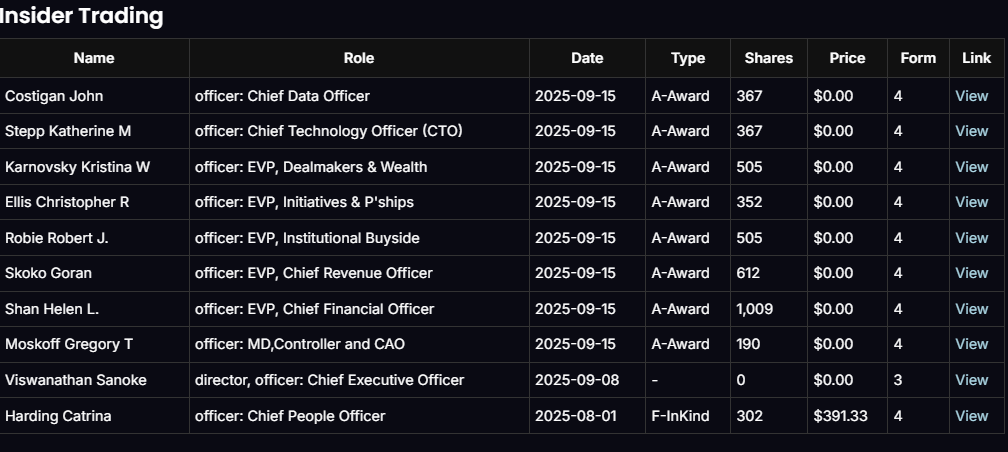
- Executives (Sept 2025): Mostly stock grants, no open-market insider buys.
- Prior insider sale (Aug 2025): At $391, above today’s price.
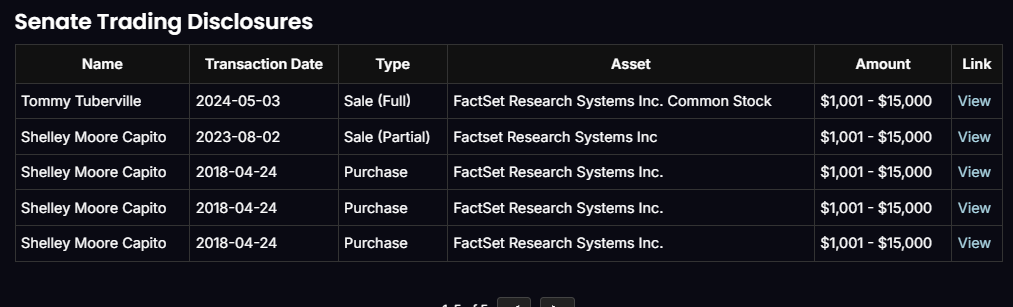
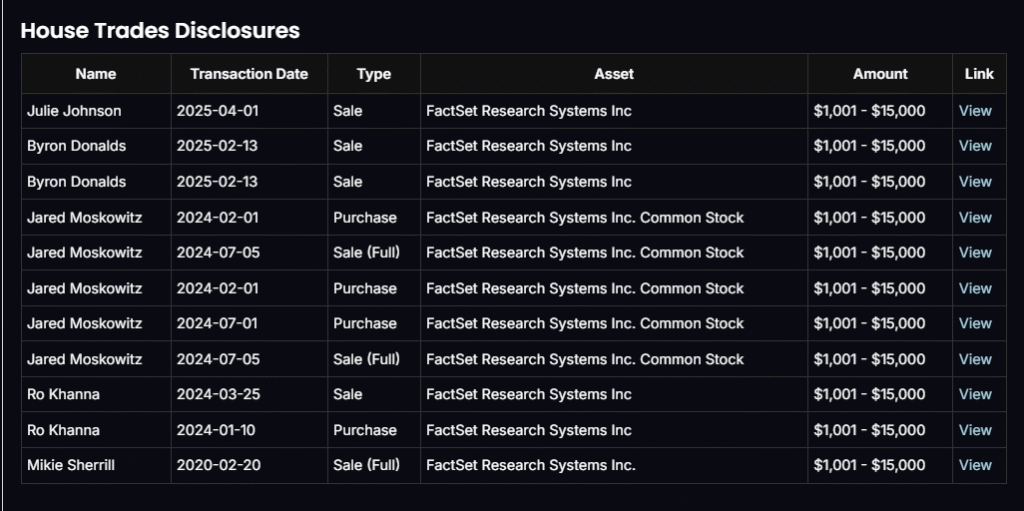
- Senate & House trades (2024–2025): More sales than buys, showing caution.
👉 Sentiment from insiders/politicians is neutral-to-bearish, not yet supportive of accumulation.
🔎 Options Strategy (LEAPS Focus)
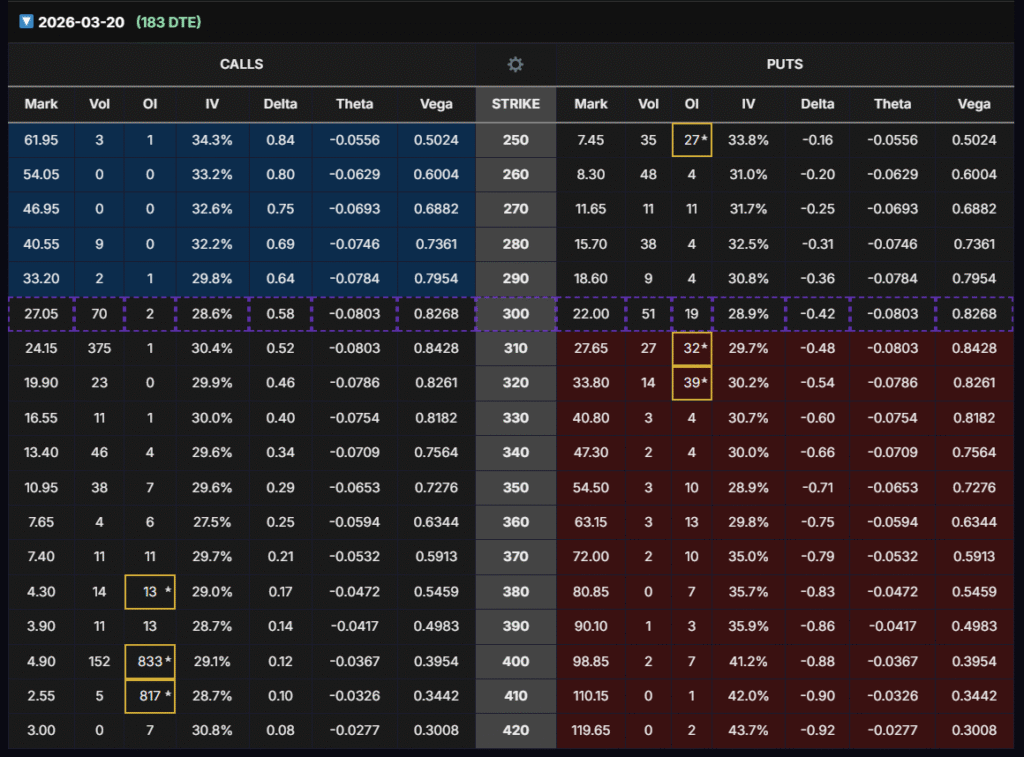
With stock deeply oversold and implied volatility relatively low (~29–31%), we target a LEAPS call option for both delta and vega exposure.
Optimal Contract:
- FDS Mar 20, 2026 $310 Call
- Premium: ~$24.15
- Delta: 0.52 → balanced directional exposure
- Vega: 0.84 → strong sensitivity to IV expansion before earnings
- Liquidity: 375 contracts traded (will reflect in OI)
Why $310?
- Slightly OTM, near delta 0.5.
- Highest vega exposure among liquid strikes.
- Cheaper than ATM ($300), offering better leverage-to-risk ratio.
📌 Hedge Fund-Style Trade Setup
- Catalyst Play: Buy when IV is depressed (now) and sell into IV expansion before next earnings.
- Profit Mechanism: Gains from vega expansion + delta upside, even if FDS doesn’t rally above $310.
- Breakeven at expiry: ~$334.15 (but strategy exits before then).
🛠 Execution Plan (3-Batch Entry Strategy)
We will scale in with three batches to manage risk and maximize entry timing:
- Batch 1 – Enter Now:
Buy initial position in FDS Mar 2026 $310 Calls at ~$24.15. - Batch 2 – Enter in 1–2 Weeks:
If Batch 1 drops -30% to -40% of the options price, add second position at lower cost basis. - Batch 3 – Enter in 1–2 Weeks After Batch 2:
If Batch 2 declines -30% to -40% of the options price, enter third and final batch.
👉 This phased approach allows us to average down strategically during volatility while still maintaining exposure if the stock rebounds early.
⚖️ Risk/Reward Snapshot
- Max Risk (per contract): $2,415.
- Potential Reward: Unlimited upside if stock recovers toward $390–450 range.
- Key Risk: Continued earnings misses and valuation compression.
✅ Final Takeaway
FactSet (FDS) is fundamentally strong but growth-challenged, with oversold technicals creating a high-risk, high-reward setup. The March 2026 $310 LEAPS call offers the optimal mix of delta, vega, and liquidity for a hedge-fund style trade. By entering in 3 staged batches, we reduce timing risk while positioning for a volatility-driven rebound.
⚠️ Capital Risk Disclosure & Disclaimer
All content provided here is for informational and educational purposes only. This is not financial advice and should not be construed as a recommendation to buy or sell any security. Options trading involves significant risk and may not be suitable for all investors. Do not allocate more than 2% of portfolio capital per position. Always conduct your own due diligence or consult with a licensed financial advisor before investing.