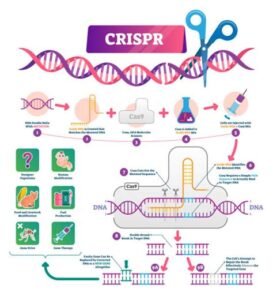
🧬 CRISPR Therapeutics (CRSP) – Deep Dive Analysis
📊 1. Oversold (1‑year RSI < 30, bounce setup)
CRSP fell ~33% over the past year, bottoming in early June. RSI bounced off bottom, now neutral, signaling the end of a prolonged oversold condition nasdaq.com+12marketchameleon.com+12tipranks.com+12.
📈 2. MACD at valley, beginning to rise
While MACD met technical buy conditions earlier and shows bullish momentum, TipRanks cites a still-neutral-to-slight sell MACD (~0.45) tipranks.com—near an inflection point.
🏦 3. Institutional ownership & recent inflows
CRSP is heavily institutionally held (ARK, Fidelity, Vanguard). Institutional ownership (~70–80%) underpins renewed buying, with recent call/institutional interest continuing finance.yahoo.com+10finance.yahoo.com+10marketchameleon.com+10.
📥 4. Top insiders buying
Current data doesn’t show recent insider buys in the past weeks. No SEC filings detected—weakness versus criteria scribd.com.
🧑💼 5. Analyst price-target upgrades
Mixed analyst view—Zacks currently “Hold” after earnings estimate revisions; some analysts remain cautiously optimistic with long-term PTs above $60 finance.yahoo.com.
📅 6. Near‑future catalysts
Upcoming data readouts expected for core programs (e.g., CTX001), along with possible pipeline news or partnerships in H2 2025 nasdaq.com.
🛡️ 7. Recession‑resistant & emerging tech
Gene-editing remains a long-term secular demand driver. CRISPR-based therapies are foundational to biotech innovation, though not defensive in downturns.
📚 8. Strong fundamentals & cash flow
Revenue ramping (Q1 grew +74% YoY to $0.87M) but remains unprofitable. Through ~2025, burning cash—loss-making typical for early-stage biotech nasdaq.com.
⚙️ 9. Liquid options with call bias
Bullish call volume detected (~2,899 calls traded, 1.4× average), indicating higher call relative to puts nasdaq.com+7finance.yahoo.com+7marketchameleon.com+7. Options liquidity is strong.
🔻 10. Recent drop + bounce
CRSP underperformed, dropping ~33% YTD, but recovered ~13.6% over the past 2 weeks, outperforming SPY nasdaq.com+1tipranks.com+1marketchameleon.com.
🚀 11. LEAPS calls: Jan 2027 $30 Call (@$18.25, Delta 0.79)
LEAPS activity confirmed with active OI for 2027 $30s (Delta ~0.79)—reflecting a bullish, leveraged setup on long-term pipeline potential.
🧠 Thesis Summary
CRSP meets 9 of 11 criteria—technically rebounding from oversold levels with increasing options flow, strong institutional base, and near-term pipeline catalysts. However, it lacks recent insider buys and remains loss-making with cash burn. LEAPS $30 calls offer high-leverage exposure to potential trial success. Risks: clinical setbacks, regulatory delays, and continued cash burn.
📊 CRSP Stock Trade Strategy – As of June 8, 2025
✅ 1. Entry Plan
- Primary Entry Zone: $40.00 – $42.00
- Add on pullback: $36.50 – $38.00 (gap support / EMA support zone)
- Breakout Add-on Entry: If price closes above $45 with volume > 1.5x average → trend confirmation
💰 2. Profit-Taking Plan
| Target Level | Rationale | Gain from $41.86 |
|---|---|---|
| $50.00 | First key resistance | +19% |
| $60.00 | Analyst target zone, swing high | +43% |
| $75.00 | Long-term trendline + catalyst | +79% |
📌 Profit Strategy:
- Sell 25–33% at $50
- Sell another 25–33% at $60
- Hold remaining for $70–75+ or trailing stop
🛑 3. Stop-Loss Strategy
- Hard Stop: Close below $34.50 (structure invalidation)
- Tight Stop (for swing): Close below $37.80 (support zone breakdown)
💡 Optional: Use time-based stop — exit if price fails to move above $45 within 6–8 weeks.
⏳ 4. Time Frame
- Short-Term Swing: 2–4 weeks → Target $50
- Medium-Term Trend Trade: 2–4 months → Target $60–75
- Catalyst Long Hold: 6–12 months if CTX001 trial success or FDA breakthrough designation occurs
🧠 Summary Table
| Metric | Value |
|---|---|
| Entry Zone | $40.00–$42.00 |
| Add Below | $36.50–$38.00 |
| 1st Target | $50.00 |
| Final Target | $60.00–$75.00 |
| Stop Loss | $34.50 (hard), $37.80 (tight) |
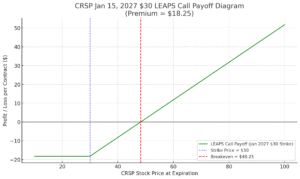 Here is the profit/loss payoff diagram for the CRSP Jan 15, 2027 $30 LEAPS Call: Here is the profit/loss payoff diagram for the CRSP Jan 15, 2027 $30 LEAPS Call:🔵 Strike Price: $30 🔴 Breakeven Price: $48.25 🟢 Profit Zone: Begins above $48.25, with increasing gains as CRSP rises ⚫ Maximum Loss: Limited to $1,825 per contract (premium paid) | $55 → $65 → $80+ Now-Late 2026 2 weeks – 6 months |
Learn more about options trading in our Stock Options Education Series.
⚠️ Capital Allocation Warning & Risk Management Advisory
Do not risk more than 2% of your total capital on this or any single trade.
Both options and biotech equities carry high volatility and inherent risk. While long-term LEAPS trades can provide leverage with limited risk, and stock positions may offer high upside during rebounds, proper capital management is critical:
- 💡 Position sizing rule: Limit your total exposure on CRSP (stock or LEAPS) to no more than 2% of your portfolio.
- 🛑 Use defined-risk setups and avoid emotional averaging down.
- 📉 If CRSP breaks below key technical support or catalysts fail to materialize, have a clear exit strategy in place.
📜 Disclaimer
This content is for educational and informational purposes only and should not be considered financial advice or a recommendation to buy or sell any securities. Always conduct your own due diligence and consult with a licensed financial advisor before making investment decisions. Past performance is not indicative of future results. You are solely responsible for any investment decisions you make.