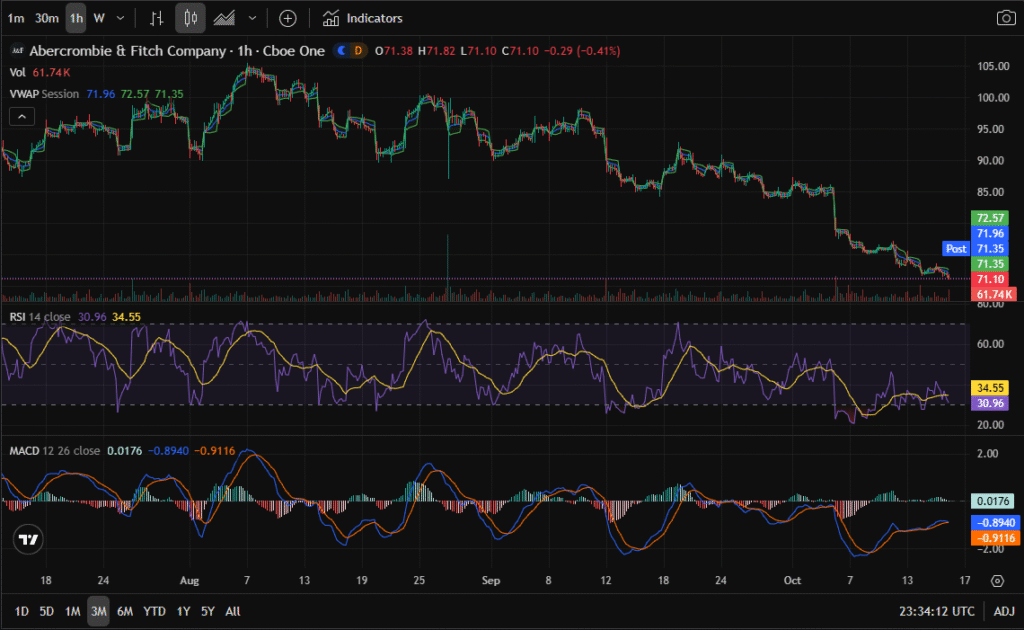
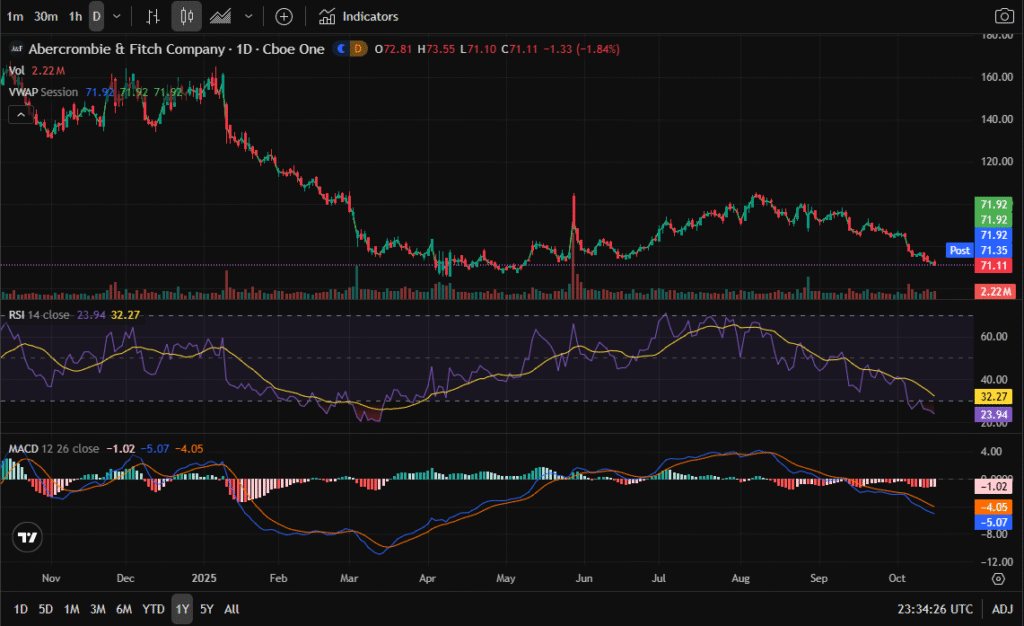
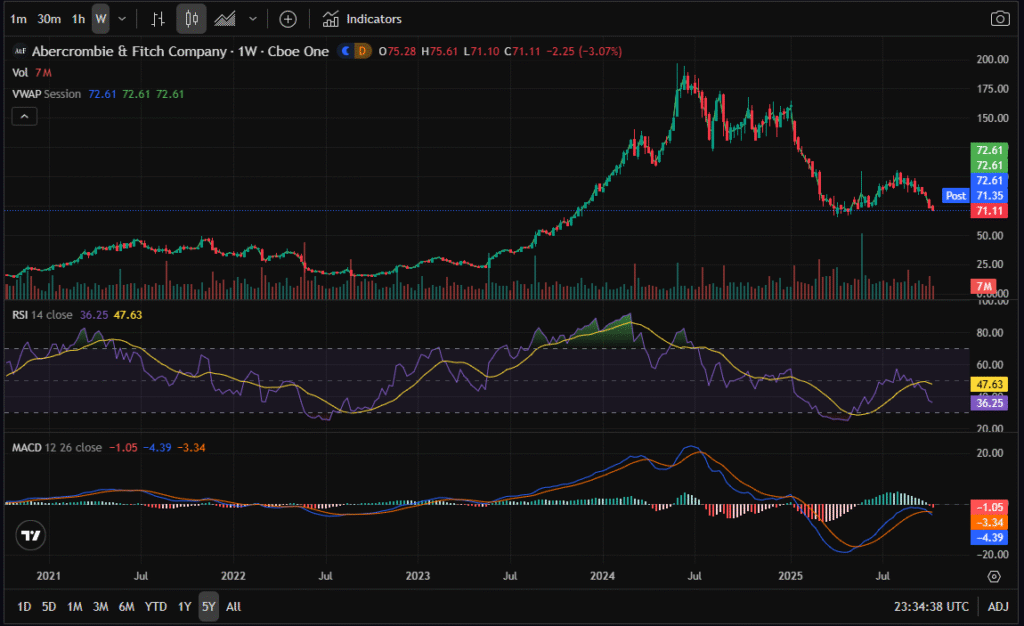
Abercrombie & Fitch (NYSE: ANF) has fallen from triple digits to the low $70s, creating one of the most asymmetric setups in months. After a multi-quarter rally that peaked near $190, shares have retraced into strong multi-year support at $68–$72.
With implied volatility compressed and the stock now oversold on every major timeframe, the stage is set for a Vega-driven rebound.
This trade targets the Jan 15, 2027 $100 LEAPS Call (≈457 DTE) — designed to profit from implied volatility expansion (Vega) and moderate Delta lift ahead of earnings.
🧭 1. Technical Overview
- Price: $71.10 (as of mid-October 2025)
- Support: $68–$72 zone (multi-timeframe floor)
- Resistance: $85–$100 short term, $120 medium term
- RSI (Daily): 24–30 → deeply oversold
- MACD (Weekly): Bearish but flattening — loss of downside strength
- VWAP: Stock trades below both 50D and 200D VWAP, signaling exhaustion phase
Technical read: Short-term sentiment remains defensive, but this type of setup—deep oversold RSI with price resting on historical support—often precedes volatility spikes and IV re-pricing events.
💰 2. Financials Snapshot (Fundamental Pillars)
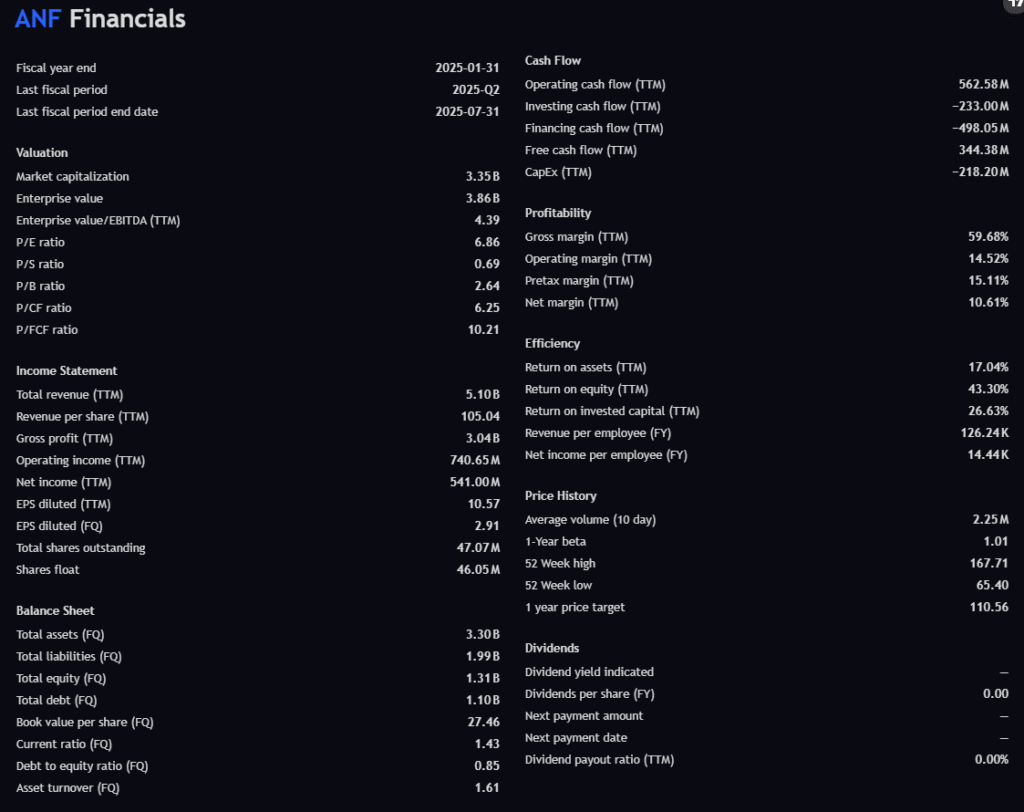
Fiscal Year End: Jan 31, 2025 Market Cap: $3.35B
Enterprise Value: $3.86B EV/EBITDA (TTM): 4.39×
| Metric | Value (TTM) | Interpretation |
|---|---|---|
| Revenue | $5.10B | Healthy top-line; consistent over prior 12 months |
| Gross Profit | $3.04B | Gross margin 59.7% — pricing power & premium positioning |
| Operating Income | $740.6M | 14.5% operating margin — strong cost control |
| Net Income | $541M | 10.6% net margin — impressive for retail sector |
| EPS (TTM) | $10.57 | Indicates substantial profitability |
| Free Cash Flow | $344.4M | Positive & expanding — self-funded growth |
| ROE | 43.3% | Exceptional capital efficiency |
| Debt-to-Equity | 0.85 | Low leverage — conservative balance sheet |
| P/E Ratio | 6.86 | Undervalued relative to peers |
| P/FCF | 10.2 | Attractive for FCF-positive growth stock |
Summary:
ANF is financially strong, cash-rich, and undervalued. The selloff appears technical rather than fundamental. This sets up ideal conditions for institutional Vega expansion — low IV, solid balance sheet, high FCF yield.
📰 3. Latest News Headlines (Market Sentiment)
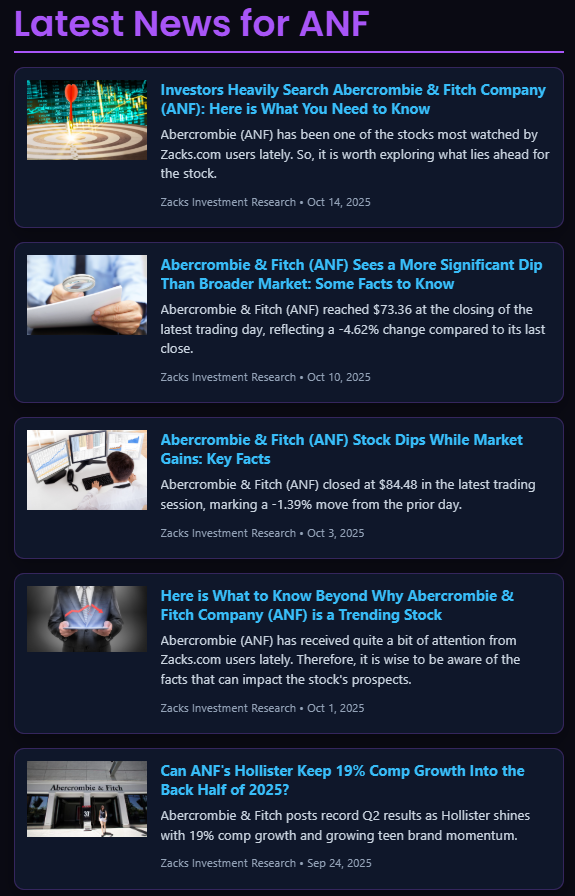
- Oct 14, 2025 — “Investors Heavily Search ANF” (Zacks): Surge in retail searches at oversold levels suggests rising speculative curiosity.
- Oct 10, 2025 — “ANF Sees a More Significant Dip Than Market”: Broad weakness exaggerated by profit-taking; signals capitulation.
- Oct 3, 2025 — “ANF Dips While Market Gains”: Divergence often marks sentiment lows.
- Sep 24, 2025 — “Can Hollister Keep 19% Comp Growth?”: Highlights operational resilience despite stock weakness.
Takeaway:
While headline tone is bearish short term, the fundamental subtext is stability beneath fear — a key environment where volatility (and Vega) tends to expand into upcoming catalysts.
📊 4. Analyst Price Targets
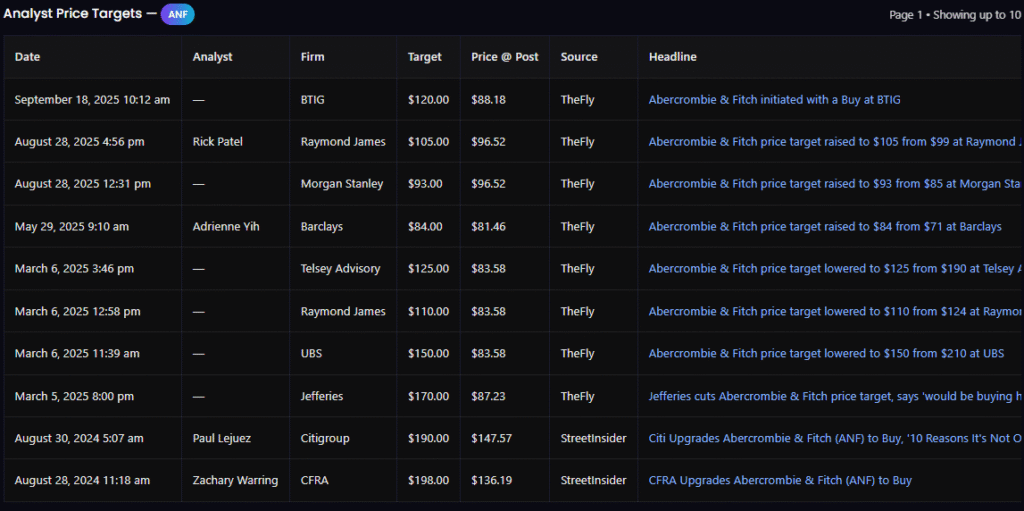
| Date | Firm | Target | Prior Target | Tone |
|---|---|---|---|---|
| Sep 18, 2025 | BTIG | $120 | New coverage | Buy |
| Aug 28, 2025 | Raymond James | $105 | $99 | Raised, Buy |
| Aug 28, 2025 | Morgan Stanley | $93 | $85 | Neutral-Bullish |
| May 29, 2025 | Barclays | $84 | $71 | Neutral |
| Mar 6, 2025 | UBS | $150 | $210 | Buy |
| Mar 6, 2025 | Telsey Advisory | $125 | $190 | Buy |
| Mar 5, 2025 | Jefferies | $170 | $210 | Buy on weakness |
| Aug 30, 2024 | Citigroup | $190 | N/A | Upgrade |
| Aug 28, 2024 | CFRA | $198 | N/A | Buy |
Consensus median target: ≈$110 → +55% upside from current levels.
Even conservative firms like Barclays show targets near $84 — matching our technical resistance zone. This alignment of analyst ranges and technical levels adds conviction to a volatility mean-reversion thesis.
🧾 5. Insider Trading Activity (Behavioral Insight)
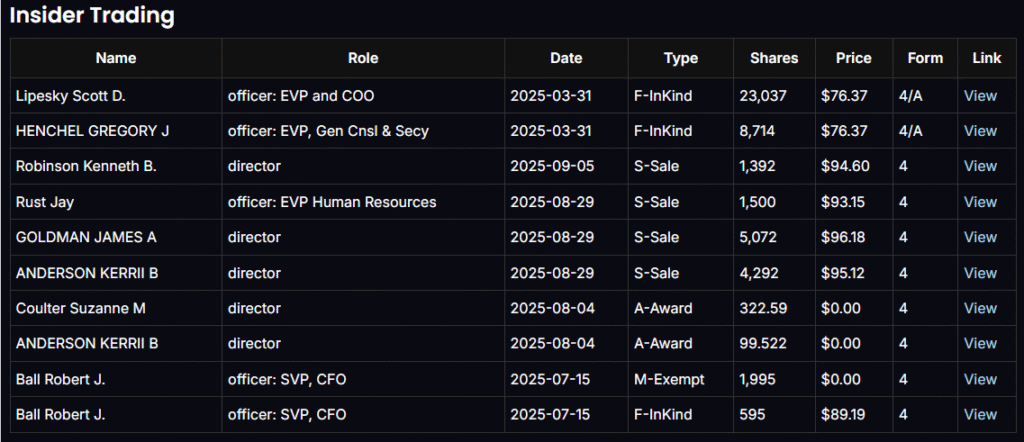
| Date | Name | Role | Type | Price | Comment |
|---|---|---|---|---|---|
| Aug–Sep 2025 | Multiple Directors | Director | S–Sale | $93–$96 | Small, profit-taking near highs |
| Jul 2025 | Robert Ball | CFO | M–Exempt / F–InKind | $89 | Compensation-related (non-bearish) |
| Mar 2025 | Exec Officers | EVP Roles | F–InKind | $76 | Vesting activity |
| None | – | – | – | – | No insider selling since correction began |
Interpretation:
No panic selling; only standard profit-taking when the stock traded 25% higher. The lack of insider liquidation near current lows strengthens the long-term confidence story.
📈 6. Options Flow Analysis (Market Positioning)
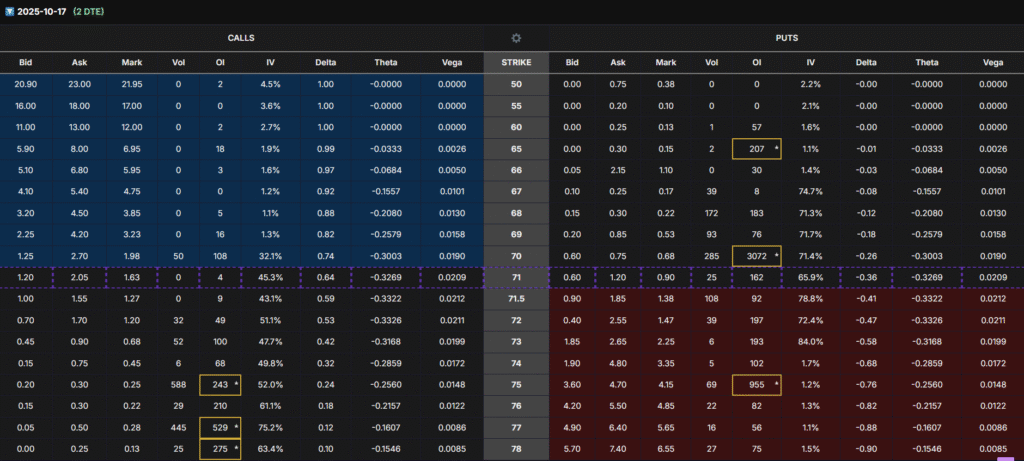
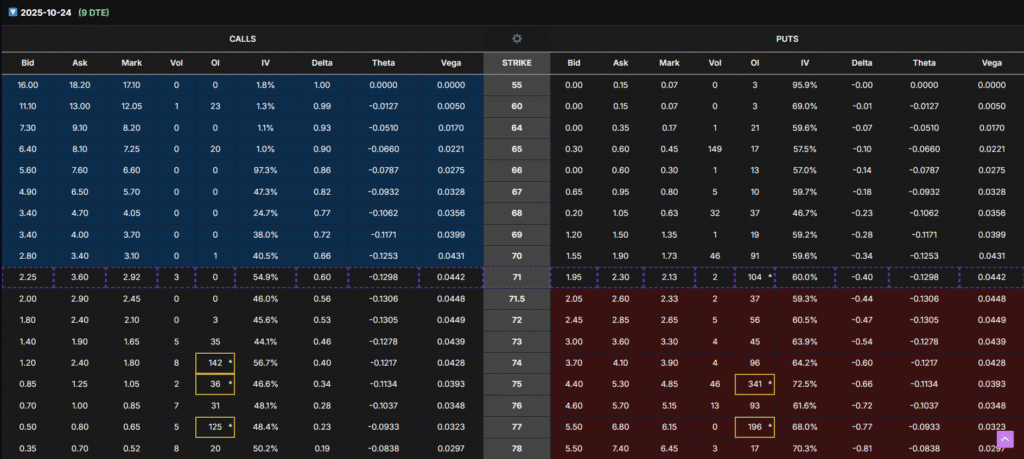
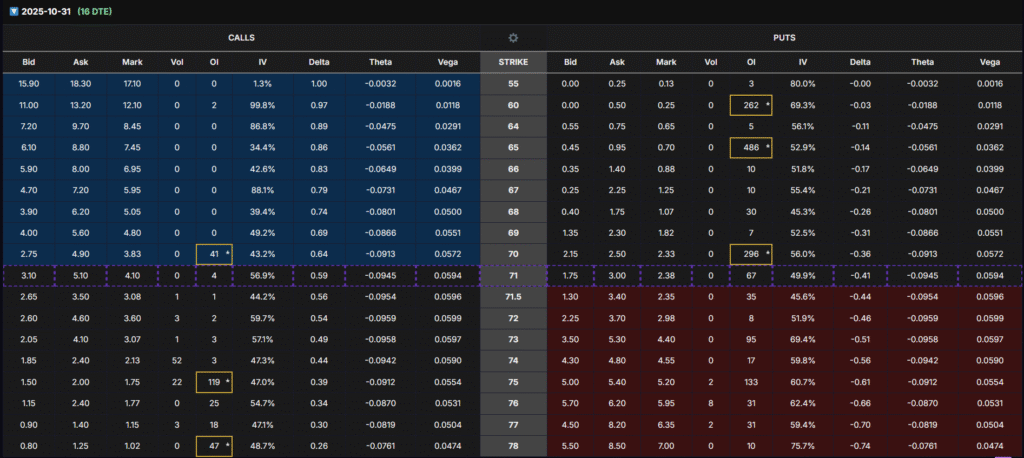
Recent chains show:
- Short-term puts (70 strike) still dominant (protective hedges).
- Calls (74–75 strikes) gradually accumulating for next week’s expirations — early signs of bottom-fishing.
- Oct 31 chain: Put OI high at $65, Call OI rising at $75 → the first bullish rotation.
- Long-dated LEAPS: Highest OI between $75 and $100 — the smart money Vega zone.
Sentiment:
Short-term defensive, but two-week outlook turning constructive — ideal environment to enter long Vega before IV reprices higher.
⚙️ 7. The Options Setup — Jan 15, 2027 $100 Call
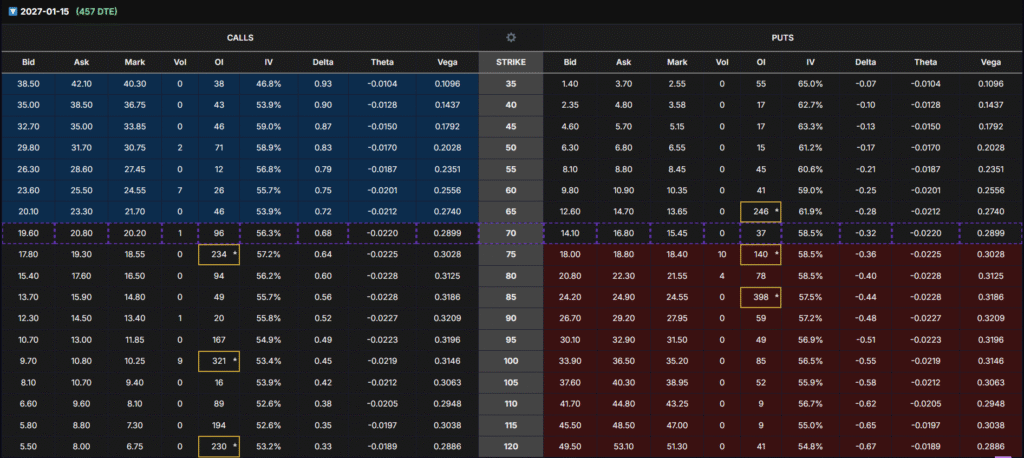
| Parameter | Value |
|---|---|
| Expiration | Jan 15, 2027 (≈457 DTE) |
| Strike | $100 |
| Current Mark | $10.25 |
| Delta | 0.45 |
| Vega | 0.32 |
| IV | 53.4% |
| Theta | -0.0219 |
| OI | 321 |
Why $100 Strike?
- Highest Vega per dollar, maximizing IV sensitivity.
- Liquid OI for scaling in/out.
- Low cost ($1,025 per contract) allows capital efficiency and batch layering.
- Delta 0.45 offers balanced directional exposure — profits both from Vega expansion and small price recovery.
Primary goal: Buy Vega cheap, sell it expensive before earnings IV ramp.
Expected Return: +80–110% within 1–2 months.
📆 8. Three-Batch Entry Plan (Scaling Smart)
| Batch | When | Condition | Purpose |
|---|---|---|---|
| Batch 1 (Now) | Immediately | IV low (~53%) | Core Vega entry |
| Batch 2 (1–2 wks) | When options price drops -40% to -50% | Cost-average | |
| Batch 3 (1–2 wks later) | When Batch 2 options price drops -40% to -50% | Final scale before IV re-expansion |
⚠️ Important: The -40% to -50% drop refers to the options price, not the stock price.
Exit Plan:
- Close 2/3 of position if option price gains +80%, secure profits.
- Let 1/3 ride toward 100–110% into IV peak before earnings.
- If trade stagnates after 2 months, roll forward to maintain Vega exposure.
🧠 9. Risk Management & Allocation
- Allocate ≤2% of total portfolio to this setup.
- Maximum risk = premium paid (fully defined).
- Time decay negligible (457 DTE); Vega expansion is the profit engine.
- Do not hold through earnings — exit as IV peaks just before the event.
✅ 10. Summary
| Aspect | Signal |
|---|---|
| Technicals | Oversold; strong base forming |
| Fundamentals | High cash flow, undervalued P/E |
| Sentiment | Bearish → neutral (turning) |
| Analyst Consensus | $110 median target (+55%) |
| Insider Behavior | No panic selling |
| Option Flows | Puts easing, calls building |
| Strategy | Buy LEAPS Vega; sell IV before earnings |
| Profit Target | +80–110% within 4–8 weeks |
| Allocation | ≤2% of portfolio |
⚖️ Disclaimer
This publication is for educational and informational purposes only and does not constitute investment advice or a solicitation to buy or sell securities. Options trading involves substantial risk and may not be suitable for all investors.
Always perform your own due diligence and consult with a licensed financial advisor before acting on any trade idea.
Use strict risk management: limit position size to ≤2% of total portfolio, scale in using the 3-batch method, and exit prior to earnings to avoid IV crush.