🔎 Technical Analysis (Multi-Timeframe)
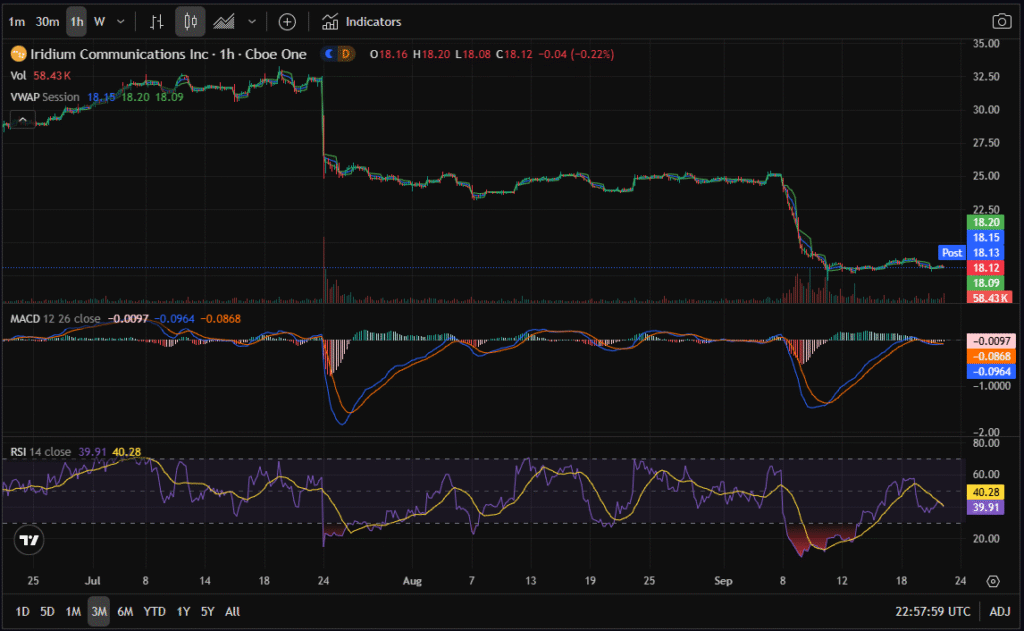
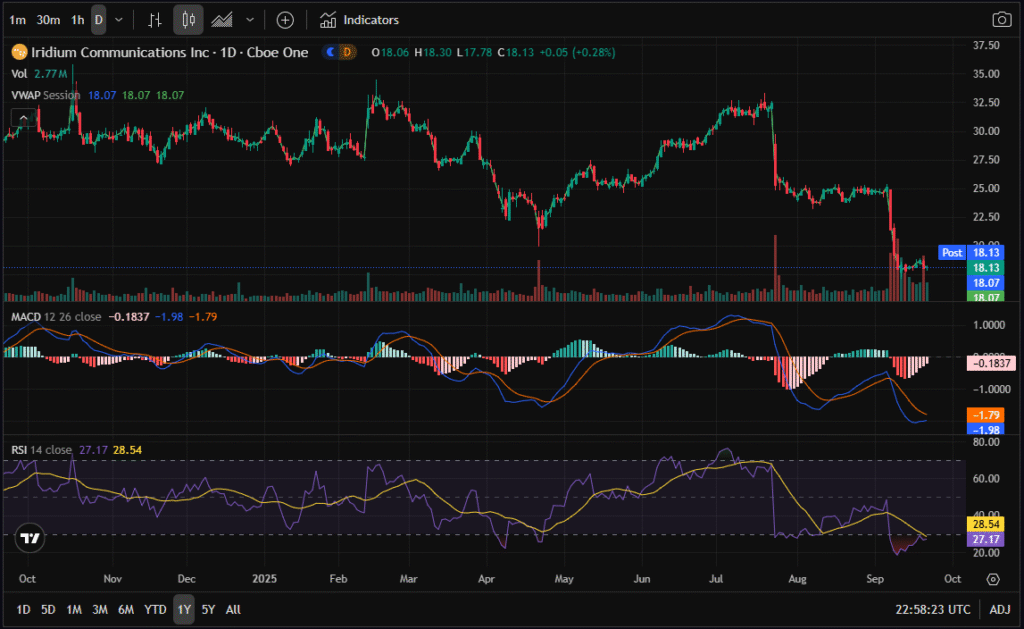
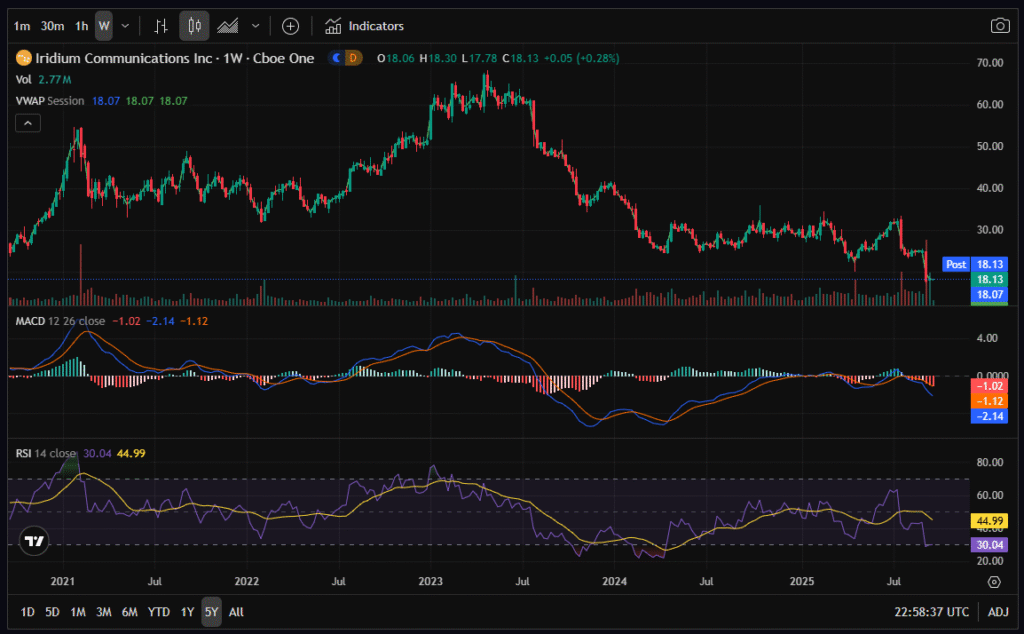
Iridium Communications (IRDM) has now entered a multi-year support test. After collapsing from the mid-$20s to the low $18s, the stock is sitting at its 3-month, 1-year, and even 5-year lows.
- 3-Month Chart: Sharp declines with stabilization near $18. MACD shows bearish crossover, but histogram momentum is slowing. RSI recovered slightly from oversold but remains weak.
- 1-Year Chart: A decisive break to new 52-week lows, confirmed by a bearish MACD crossover. RSI dipped to ~28, showing oversold conditions. Historically, IRDM has bounced when RSI hits the 20s, but momentum is still negative.
- 5-Year Chart: The stock is testing levels last seen in the early 2020s. MACD remains bearish, but RSI is near long-term oversold zones (~30), signaling a possible cyclical bottom.
📌 Takeaway: IRDM is at a critical inflection. Either $18 holds as a long-term support, or the stock risks sliding further to the $15–16 zone.
📊 Financials Overview
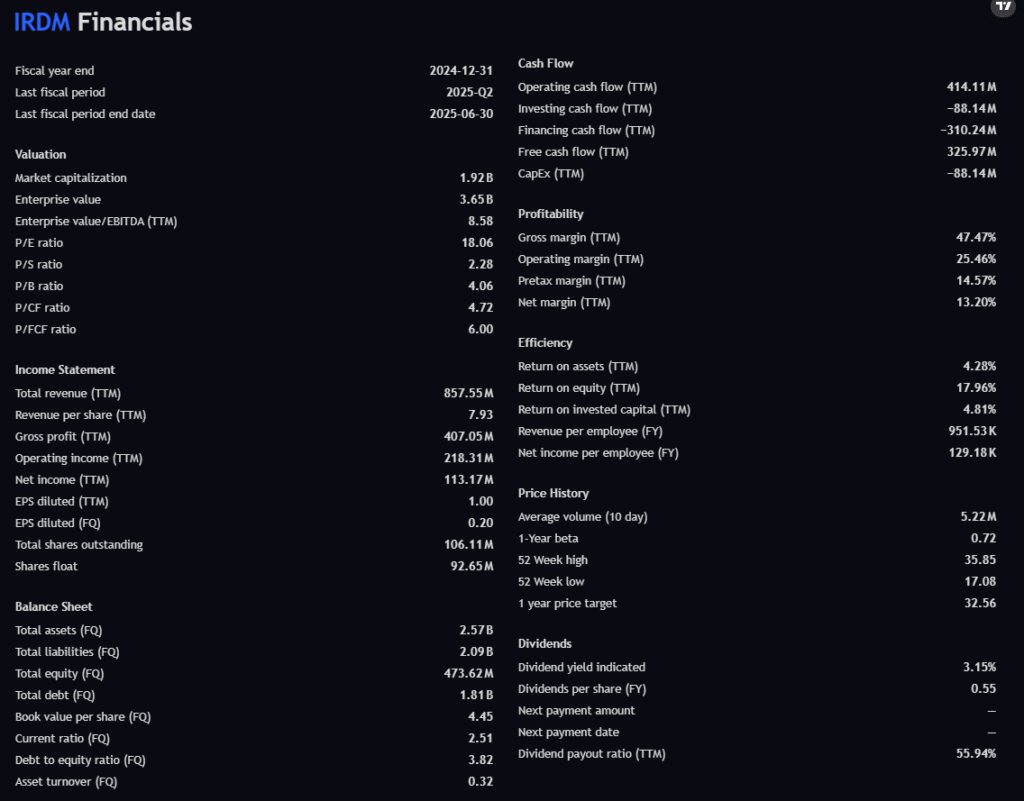
- Revenue (TTM): $857M – steady but not hyper-growth.
- Gross Margin: 47.5% (solid for telecom/satellite).
- Net Margin: 13.2% (respectable).
- Free Cash Flow: $326M – strong positive FCF gives IRDM breathing room.
- ROE: 18% – very strong, above hedge fund thresholds.
- Debt-to-Equity: 3.82 – a major red flag, with $1.8B in debt vs $474M equity.
📌 Interpretation: IRDM is cash-flow positive with healthy margins, but debt is its Achilles heel. Continued positive FCF is critical for survival and growth.
📰 Recent News
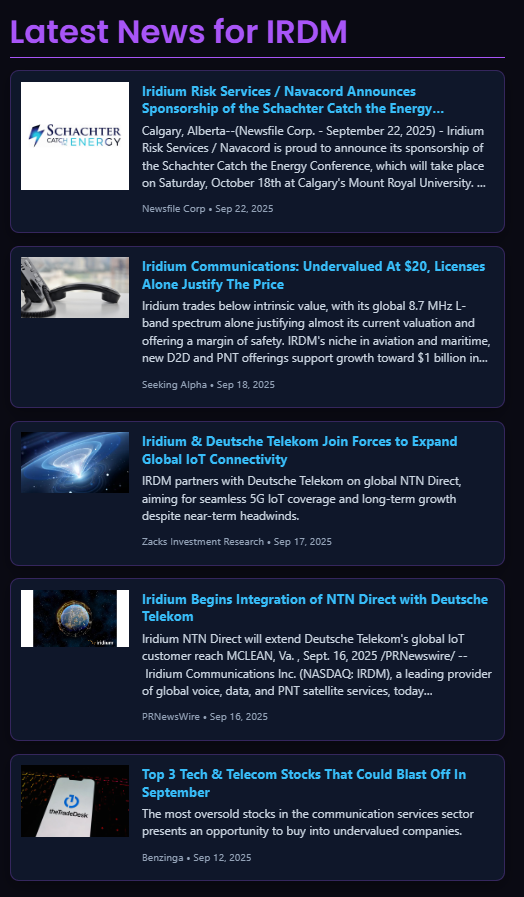
- Undervalued Thesis: Seeking Alpha highlights IRDM’s licenses alone justify its current valuation.
- Deutsche Telekom Partnership: Expands global IoT reach, aligning with the growing NTN (non-terrestrial network) trend.
- Execution Updates: Integration with Deutsche Telekom’s IoT customers already in motion.
- Media Recognition: Appears on contrarian oversold stock screens.
📌 Interpretation: News flow is fundamentally bullish, focusing on spectrum value and IoT growth. Short-term technicals are bearish, but the narrative is shifting toward undervaluation and growth prospects.
📌 Analyst Targets
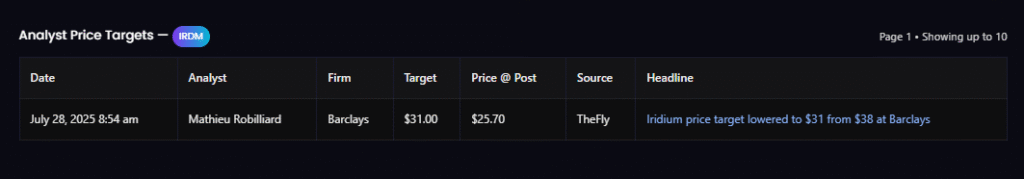
- Barclays: Cut target from $38 → $31 in July.
- Today’s Price: ~$18.
- Upside: Even after the downgrade, this still implies +70% upside from current levels.
📌 Interpretation: Analyst downgrade was not a bearish thesis, but rather a tempering of expectations. Long-term valuation remains supportive.
🕵️ Insider Activity
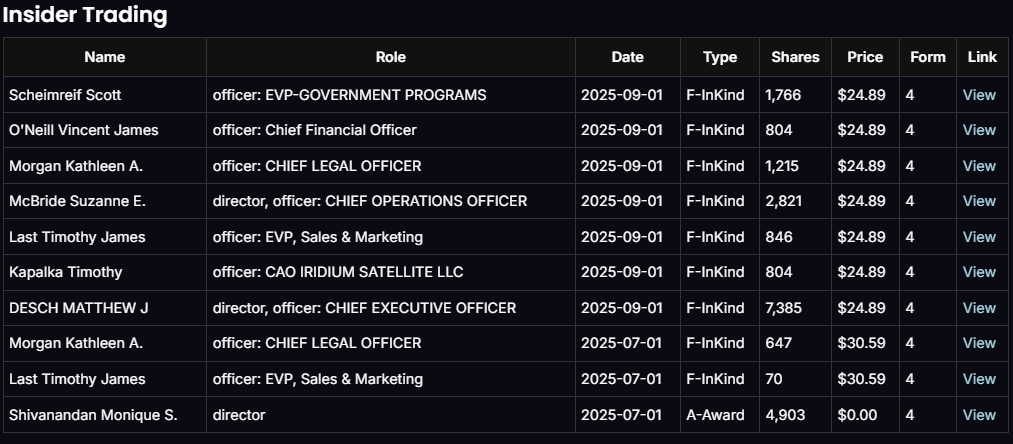
- Executives (CEO, CFO, COO, CLO, EVP) all received stock grants around $24.89 (well above today’s $18).
- No open-market buying observed yet.
- Insiders are underwater on grants, which may align incentives to push for recovery.
📌 Interpretation: Neutral. No insider panic selling, but open-market buys would provide a stronger bullish signal.
📈 Options Flow
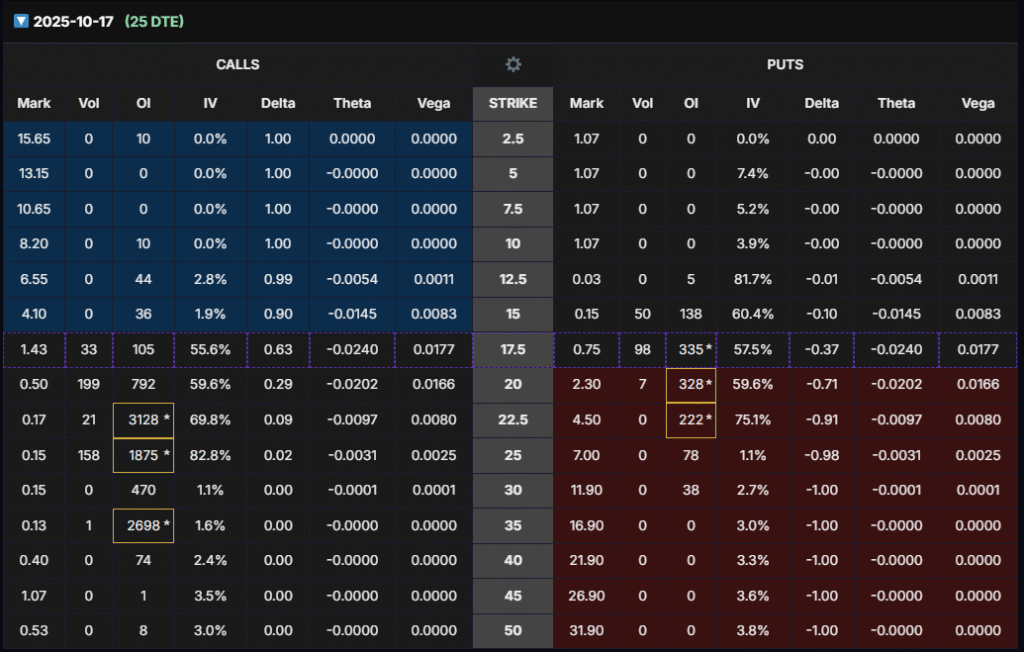
- October (25 DTE): Heavy OI at $22.5C and $25C → speculative bullish bets.
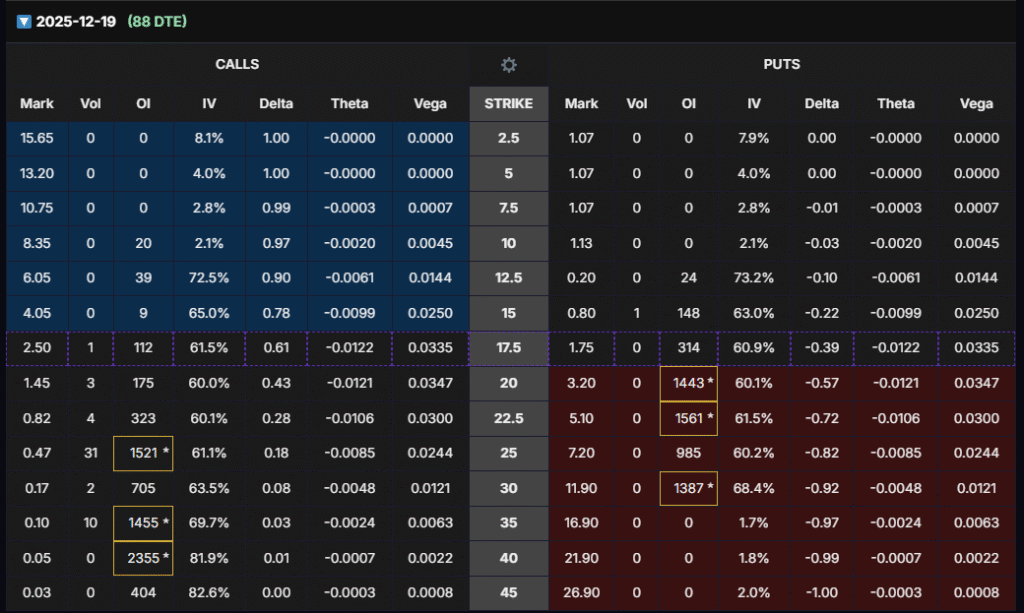
- December (88 DTE): Large OI at $25C, $35C, $40C → medium-term bullish bets.
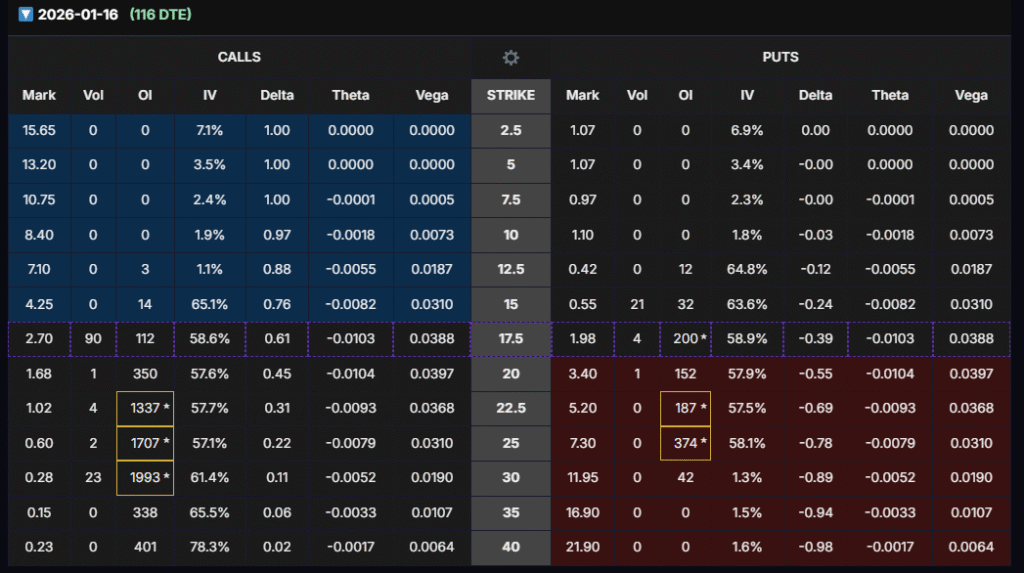
- January (116 DTE): Strong OI at $22.5C–$30C → structured bullish positioning.
- April (207 DTE): Largest OI at $20C (1,626 contracts) with delta ~0.50 and vega 0.053 → institutional sweet spot.
📌 Interpretation: Options flow is bullish. Traders are betting on a recovery into the $22–30 range, aligning with analyst targets and IV expansion into earnings.
🎯 LEAPS Strategy – Batch 2 Setup
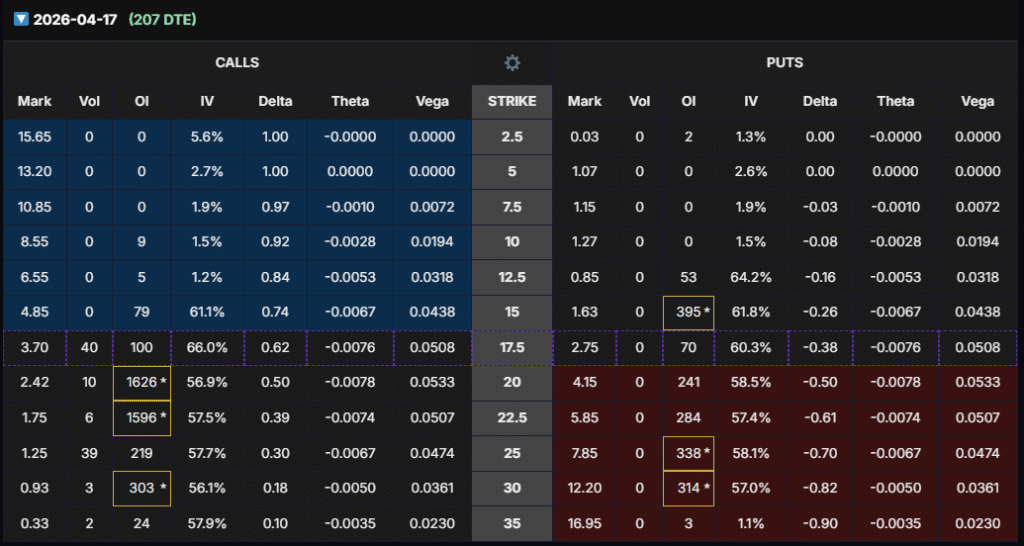
- Selected Contract: $20C (Apr 2026, ~207 DTE).
- Why $20C:
- Delta ~0.50 (perfect balance).
- Highest OI (1,626) ensures liquidity.
- Strong vega → maximum benefit from IV ramp into earnings.
- Catalyst: IRDM reports earnings in ~1 month. Historically, IV surges into earnings, making this an optimal vega play.
- Exit Plan: Sell before earnings release, when IV peaks. Profit target: +80% minimum (realistically could be +100–150% if IRDM rallies modestly).
- Risk: If IRDM stagnates, time decay will be slow due to long DTE. If it drops further ($16–17), option could lose -30% to -40%.
📌 Interpretation: This is a vega + delta leveraged play, not a simple directional bet. We’re monetizing volatility into earnings rather than needing the stock to exceed strike price.
⚖️ Final Outlook
- Technical View: Oversold at multi-year lows.
- Fundamentals: Strong FCF and margins offset by high leverage.
- News Flow: Bullish on licenses + IoT partnerships.
- Analysts: Still see ~70% upside from here.
- Options Flow: Bullish, clustering around $20–30 strikes.
- Strategy: Buy $20C Apr 2026 LEAPS now (Batch 2), close before earnings IV peak, target +80% or higher.
📌 Entry Plan (3 Batches)
We are scaling in with a three-batch system:
- Batch 1: Already entered.
- Batch 2: Enter now at $20C Apr 2026 while options prices are depressed.
- Batch 3: Enter only if the options price of Batch 2 drops another -40% to -50% of the options price (not the stock price).
This ensures we average down efficiently while controlling risk.
⚠️ Disclaimer
This analysis is for educational and informational purposes only. It does not constitute financial advice. Options are highly speculative and carry risk of total loss. We recommend allocating no more than 2% of total portfolio capital to this strategy. Holding period should be maximum 2 months; if profits do not materialize, rollover is necessary.