Super Micro Computer (SMCI) has undergone a violent, multi-month selloff, collapsing from the $60 range down into a deep oversold zone near $33. This dramatic decline, driven by margin compression, temporary revenue softness, analyst downgrades, and negative sentiment headlines, now presents a rare asymmetric opportunity for long-dated LEAPS traders.
This analysis brings together technical charts, financial conditions, news flows, analyst targets, insider trading, options flow, and finally the LEAPS strategy setup, offering a full 360-degree perspective.
🔹 1. Technical Analysis: Oversold Across All Timeframes
3-Month Chart (Short-Term)
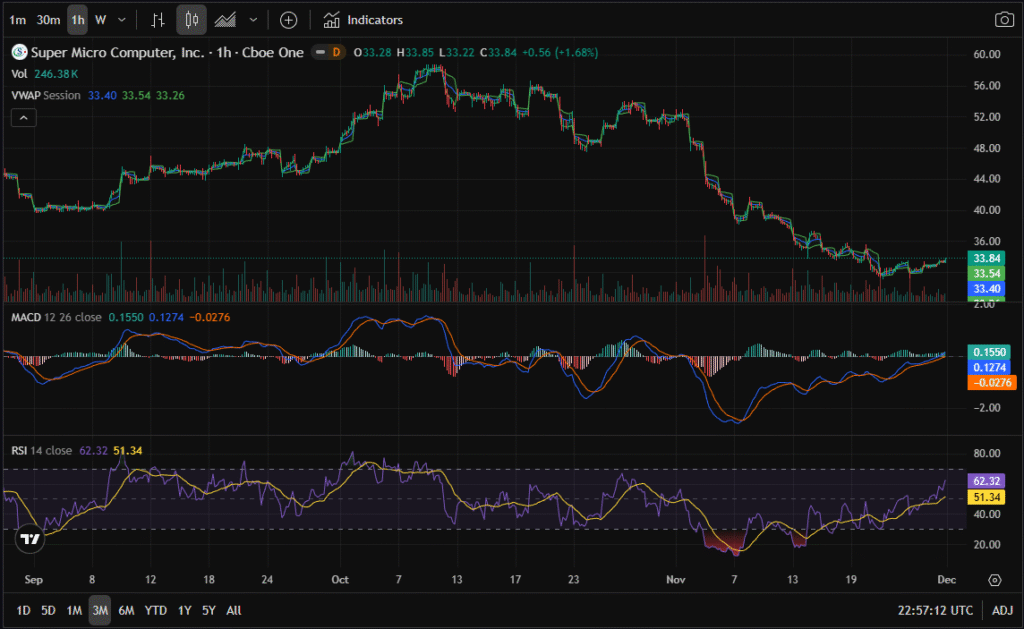
SMCI is sitting at a 3-month low, but the early stages of a short-term reversal are forming.
- The MACD shows a slight bullish crossover, signaling momentum recovery.
- The RSI is elevated, meaning the stock has bounced from the bottom, but not yet reversed the broader trend.
- Price is attempting to reclaim short-term moving averages.
The takeaway: The short-term chart says “bounce in progress,” but strong resistance remains overhead.
1-Year Chart (Medium-Term)
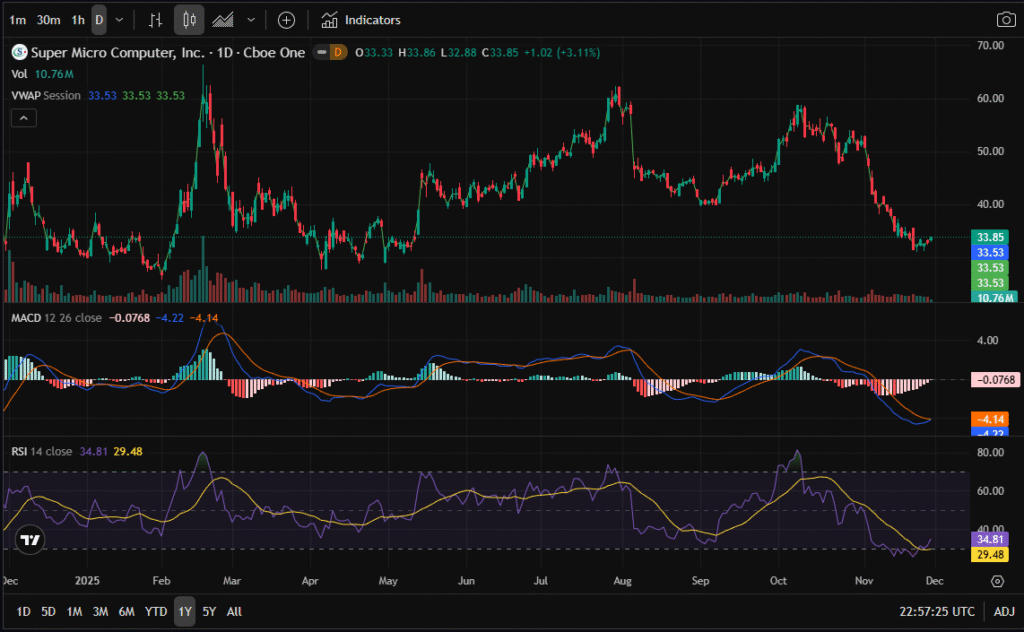
SMCI is extremely oversold on the 1-year timeframe.
- RSI sits near 34, historically where SMCI begins major reversals.
- MACD is about to turn bullish, which is one of the most reliable indicators for medium-term reversals.
- SMCI is holding the same support region from early 2024, creating a major double-bottom potential.
This is the strongest bullish timeframe.
5-Year Chart (Long-Term)
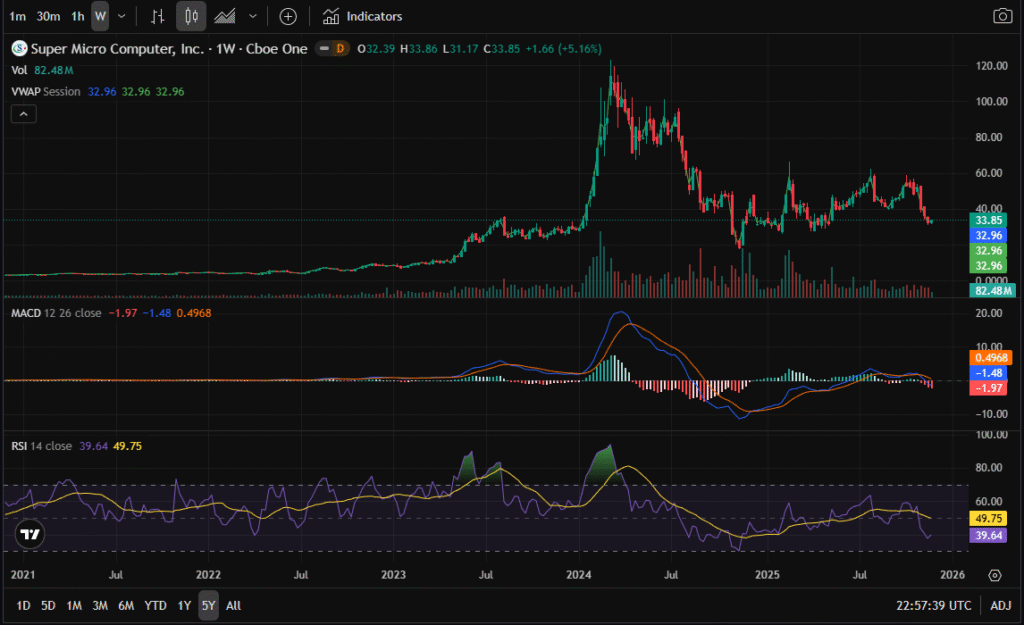
The long-term chart shows a stock that soared massively during the AI server boom… and has now fully retraced.
- Weekly MACD remains bearish.
- RSI is neutral around 40.
- Price sits near deep structural support zones.
This suggests that SMCI may still need macro strength to reverse, but the downside from here is significantly lower than earlier months.
🔹 2. Financials: Strong Core Business Despite Margin Pressure
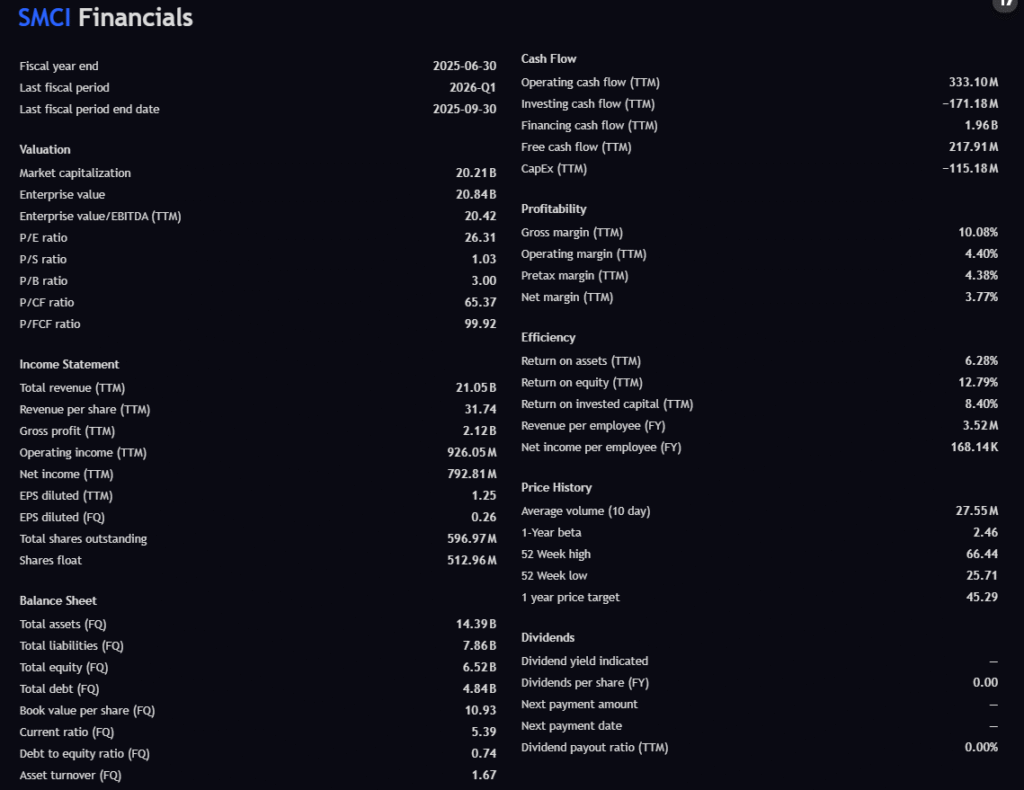
SMCI’s financials present a mixed but overall stable picture:
- Positive Free Cash Flow (TTM): $217.9M
- Low Debt-to-Equity: 0.74 (very healthy)
- ROE: 12.79%, ROIC: 8.40% (solid efficiency metrics)
- P/B Ratio: 3.0, fairly valued
- Margins are low (Gross margin ~10%, Net margin ~3.7%)
The low margins partially explain why SMCI is trading at such depressed levels. However, the company is not financially distressed — it is cash-flow positive, has a strong balance sheet, and continues to generate revenue above $21 billion annually.
🔹 3. News Headlines: Sentiment Has Capitulated
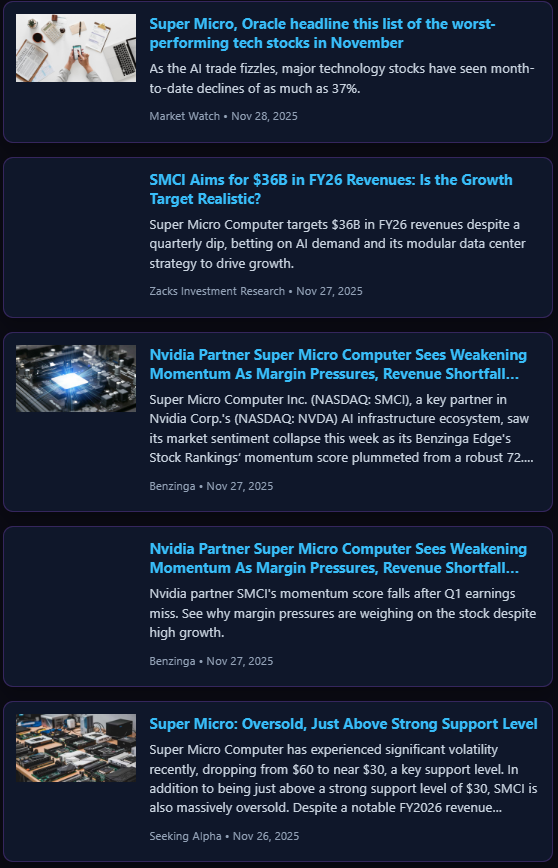
Recent headlines show peak negativity:
- “Worst-performing tech stock in November”
- “Weakening momentum”
- “Margin pressures, revenue shortfall”
But crucially:
- These types of headlines usually appear near bottoms, not tops.
- Seeking Alpha highlighted SMCI as “Oversold, Above Strong Support.”
This combination of extreme negative sentiment + fundamental strength often precedes major recoveries.
🔹 4. Analyst Price Targets: Clustered Far Above Current Price
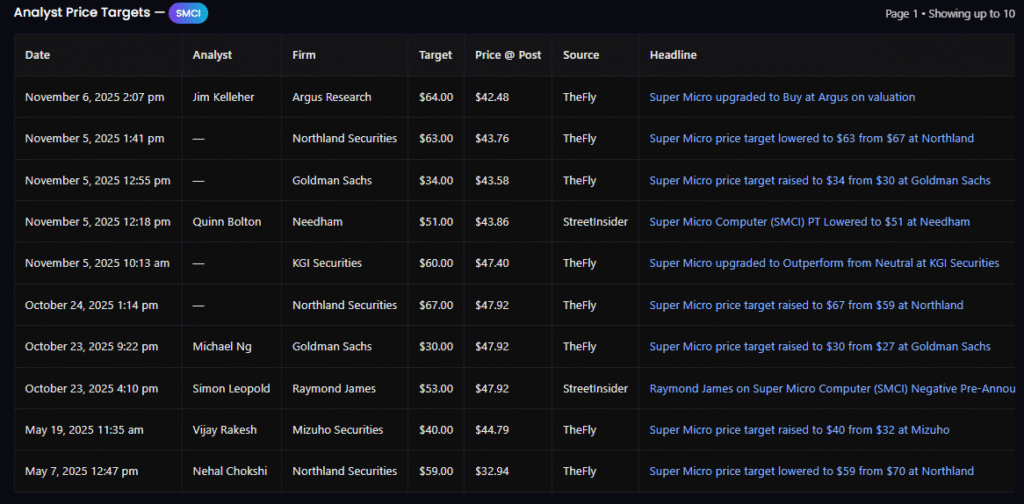
Across major firms:
- Average price target = $52.10
- Current price = ~$33–34
→ +50% upside based on analyst consensus.
Targets range from:
- Bearish: $30 (Goldman)
- Neutral: $40–53
- Bullish: $60–67
Current price reflects the bear case, not the average or bull case.
This creates a large valuation gap that benefits LEAPS positioning.
🔹 5. Insider Trading: Neutral to Slightly Bearish
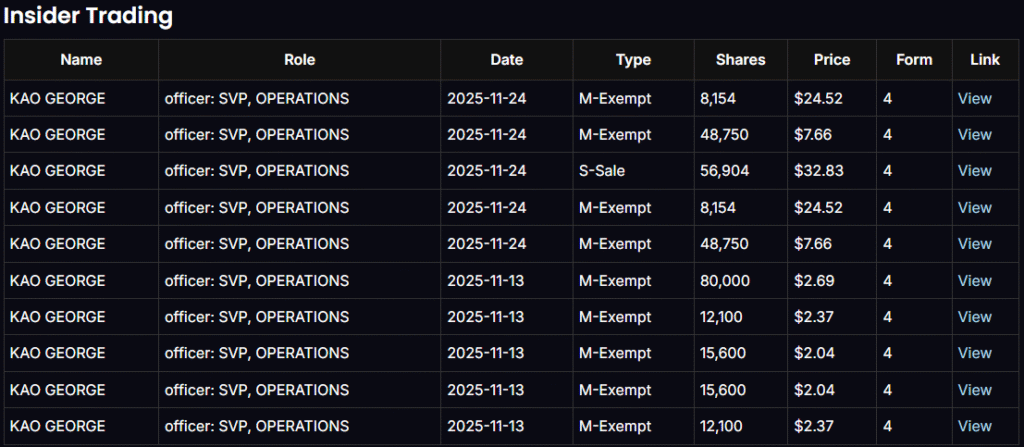
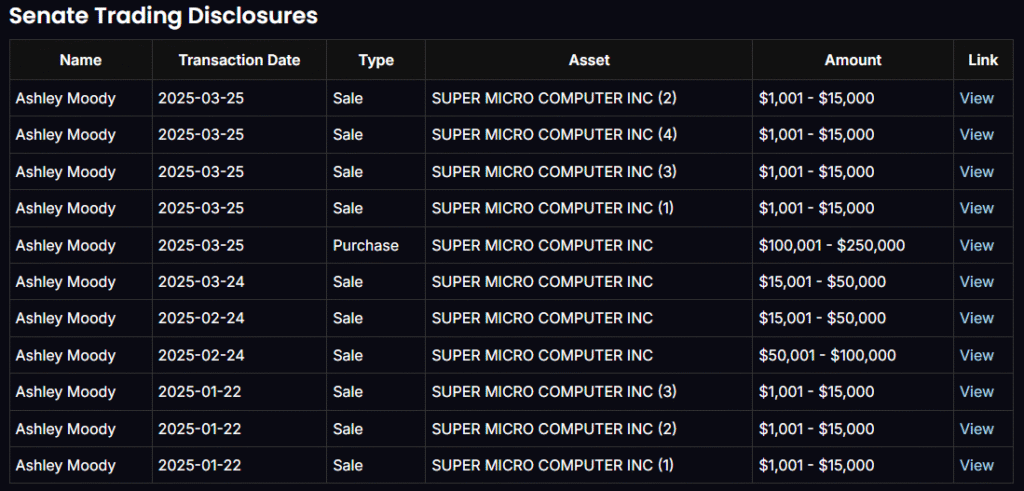
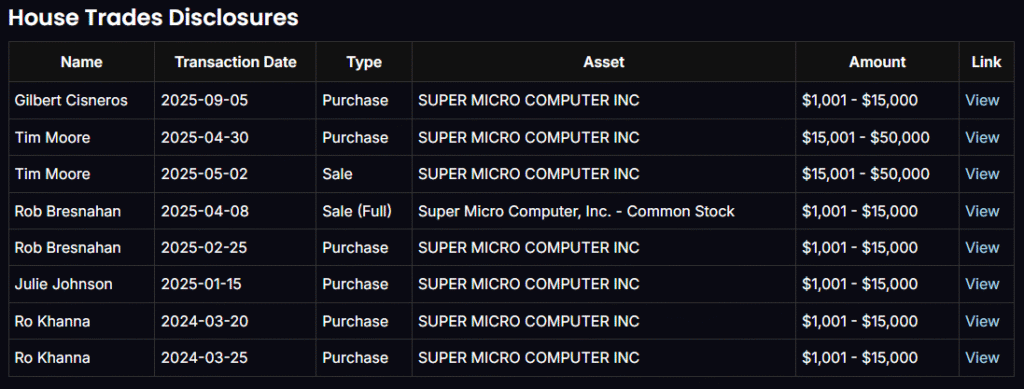
- SVP George Kao filed several M-Exempt option exercises (neutral).
- One meaningful sale at $32.83 (slightly bearish).
- No large-scale panic selling from insiders.
- Senate trades lean bearish, while House trades show small but consistent accumulation.
Overall insider sentiment: neutral to slightly negative, but not alarming.
🔹 6. Options Flow: Short-Term Capped, Medium-Term Bullish
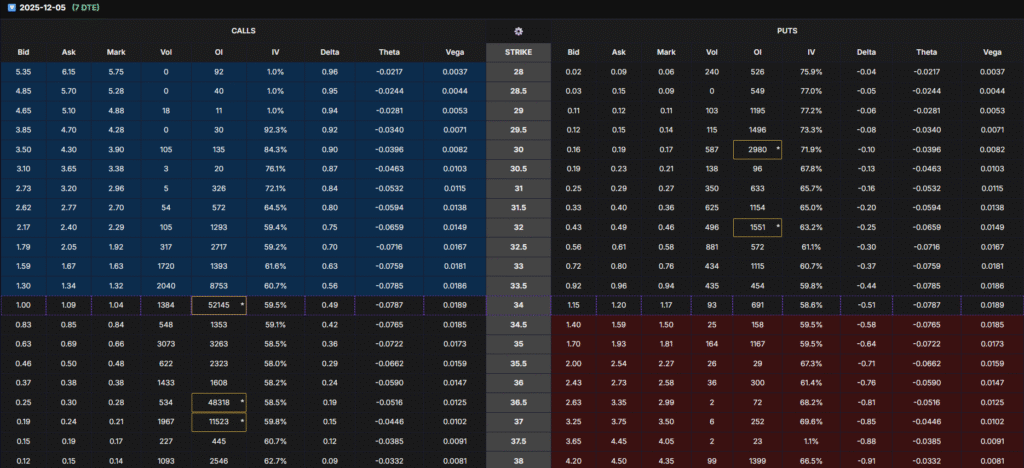


Short-Term (Dec 5)
- Massive 34 call wall (52,145 OI) indicating resistance.
- Short-term sentiment bearish.
Medium-Term (Dec 12–19)
- Increasing OTM call interest at 35–38 strikes.
- Indicates traders are positioning for a rebound in mid-December.
Long-Term (LEAPS)
- Healthy OI near 30–33 strikes.
- Suggests institutions prefer accumulating ITM/near-ITM calls for long-term recovery.
Call-side conclusion:
Short-term capped, medium-term bullish, long-term favorable for LEAPS.
🔹 7. The LEAPS Options Setup — Strike 32 (Jan 15, 2027, 413 DTE)
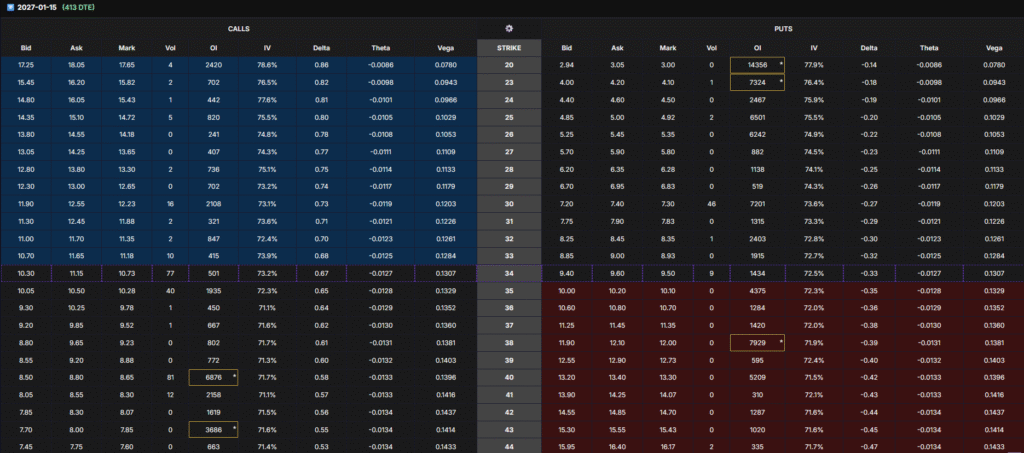
For a bullish recovery play, the 32 strike is optimal:
- Delta = ~0.70 (ideal for LEAPS growth)
- Vega = 0.1226 (benefits from IV normalization)
- OI = 847 (strong liquidity)
- Slightly OTM — perfect leverage without excessive risk
- Will flip ITM quickly once SMCI rises above $35–36
- Ideal for +60% to +100% profit during a medium-term rally
With SMCI deeply oversold and sentiment bottoming, delta expansion from 0.70 → 0.85+ can create powerful gains without needing the stock to make dramatic moves.
Holding Plan
- Hold ONLY for 1–3 months.
- We do NOT hold until expiration.
- If SMCI stagnates, we roll to maintain time value.
🔹 8. Multi-Batch Entry Strategy (Risk Management)
To avoid timing risk:
Batch 1 — Enter Now
Use the 32 strike LEAPS (413 DTE).
Batch 2 — ONLY if needed
If the options price (NOT the stock) falls –40% to –50%,
we re-analyze and consider adding a second batch.
Batch 3 — ONLY if needed
If the second batch options price falls –40–50% of the options price,
we reassess and potentially add a third batch.
This scaling method prevents overexposure if the stock dips further.
🔒 Important Disclaimer
This article is for educational purposes only and not financial advice.
Options involve significant risk.
You should only allocate a maximum of 2% of your total portfolio into any single options position to avoid catastrophic losses.
Past performance does not guarantee future results.
Always consult a licensed financial professional before investing.
✔ Final Verdict
SMCI shows classic signs of a deep oversold capitulation, combined with:
- stable financials
- positive cash flow
- technical bottoming
- supportive analyst targets
- medium-term call accumulation
- strong LEAPS setup
The 32 strike LEAPS (Jan 15, 2027) offers one of the best asymmetric reward scenarios for a medium-term recovery.