
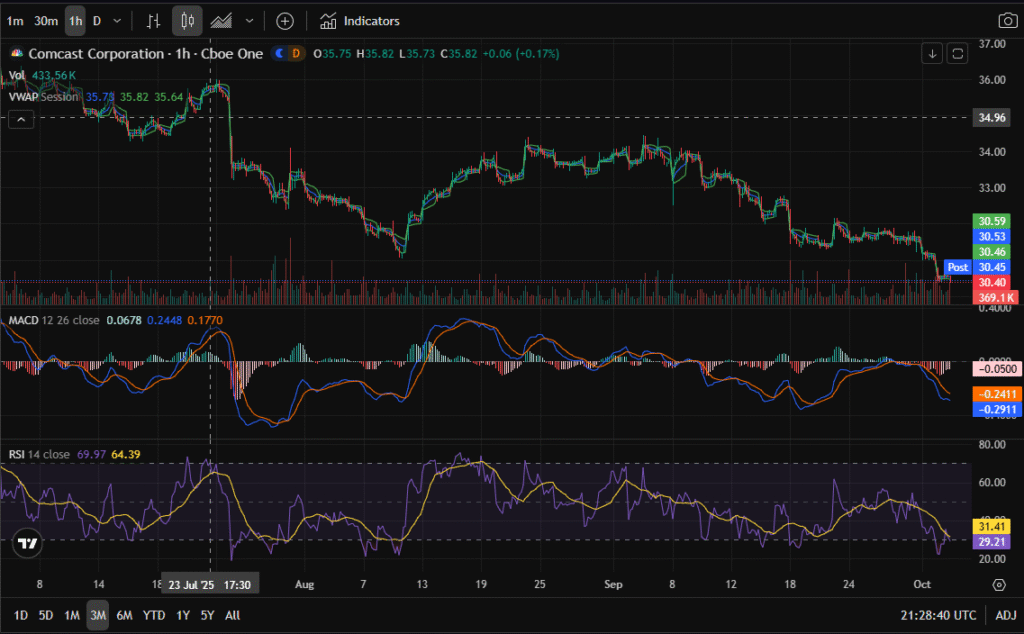
Short-Term Technicals (3M)
Comcast (CMCSA) has been in a sharp downtrend over the past three months, sliding to new 3-month lows near $30.40. Technical signals are decisively bearish:
- RSI: Oversold (31.41)
- MACD: Bearish crossover
- Volume: Heavy red bars confirm institutional selling
Despite the short-term weakness, oversold RSI suggests the potential for a dead-cat bounce in the near term.
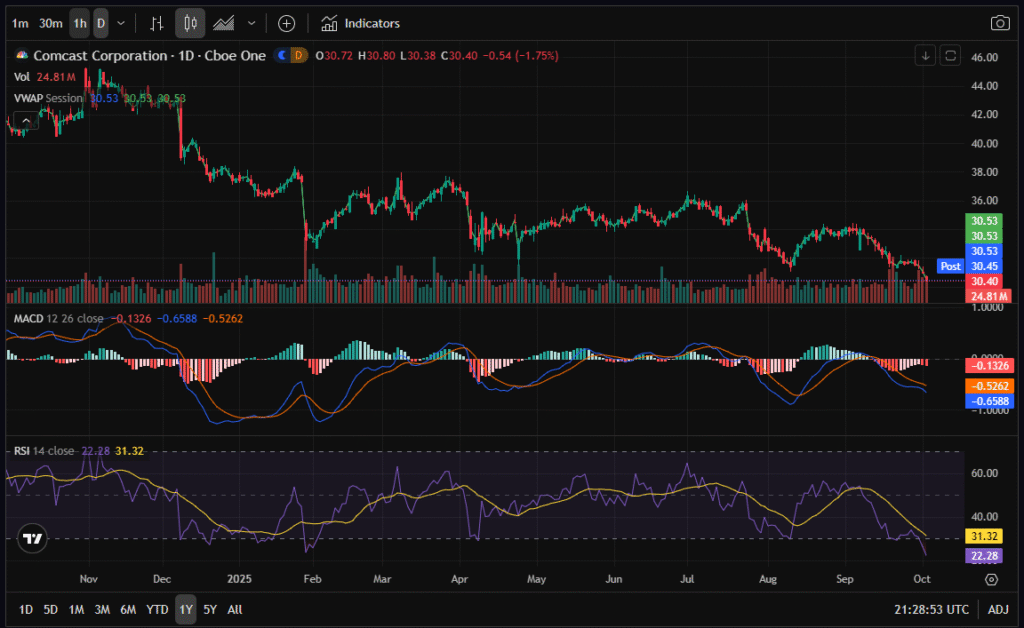
Medium-Term Technicals (1Y)
Looking at the one-year view, CMCSA is at a 1-year low, having broken through critical $32–33 support.
- RSI: Extremely oversold (22.28)
- MACD: Bearish and deep below zero
- Price Trend: Clear pattern of lower highs and lower lows
This confirms the medium-term downtrend, though historically, such oversold readings often precede at least a relief rally.
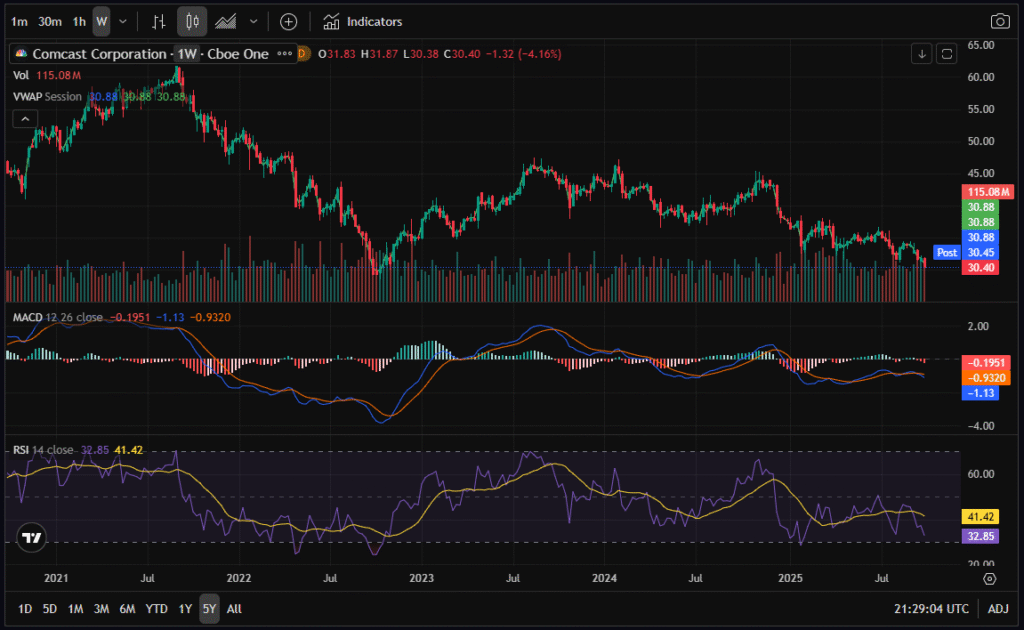
Long-Term Technicals (5Y)
On the five-year chart, CMCSA trades near its lowest levels since the COVID crash, hovering around $30.
- RSI: Oversold (32.85)
- MACD: Bearish crossover
- Support Levels: Key support sits near $28; a break below could expose downside to $25.
In summary, CMCSA is deeply oversold across all timeframes. While technically weak, this presents a value entry point for option traders looking to benefit from volatility expansion.
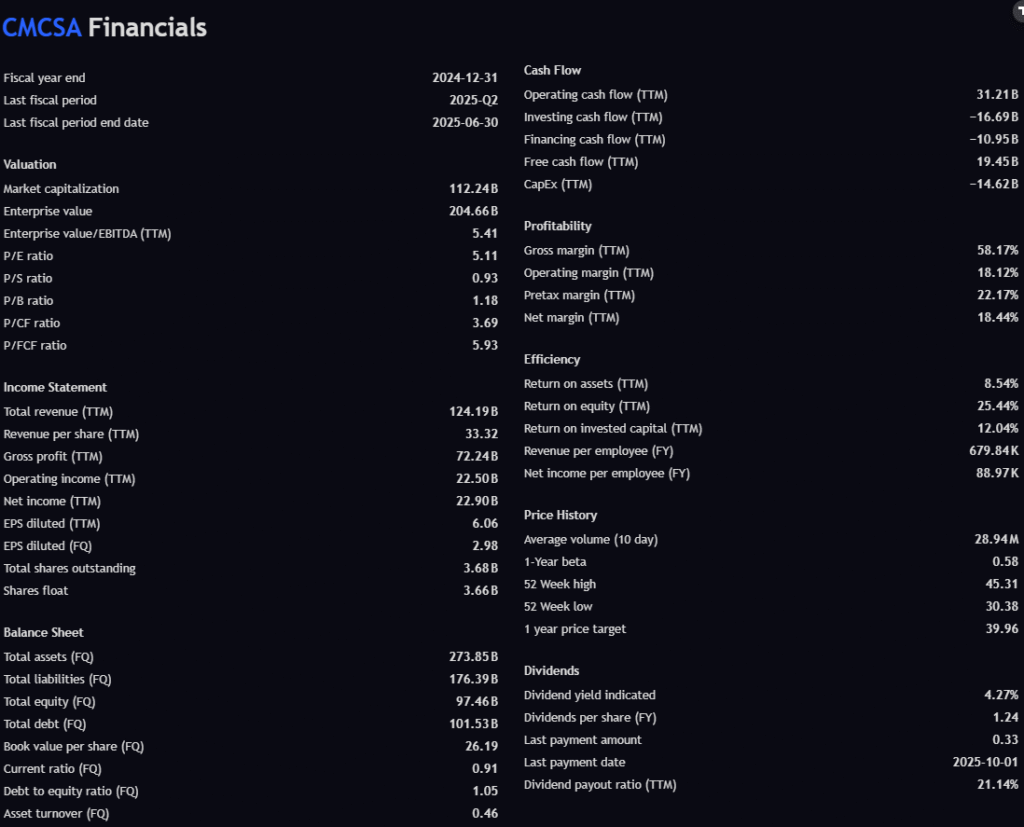
Fundamental Strength
Despite the bearish technicals, Comcast remains financially robust:
- Gross Margin: 58.17% (excellent for telecom/media)
- Operating Margin: 18.12%
- Net Margin: 18.44%
- Free Cash Flow (TTM): $19.45B
- P/E Ratio: 5.11 → extremely undervalued relative to peers
- ROE: 25.44% (very strong capital efficiency)
While debt is elevated ($101.5B, D/E 1.05), the company generates ample cash flow to service obligations and maintain its dividend.
📰 News Flow – Dividend Strength but Weak Price Action

Recent headlines frame CMCSA as a high-yield dividend play, with firms like Goldman Sachs highlighting it in their October picks. Meanwhile, Zacks pointed out that Comcast stock continues to sink even as broader markets rise — a sign of company-specific weakness. On the positive side, Comcast continues expanding Lift Zone initiatives to strengthen its broadband moat.
The split narrative: fundamentals and dividend yield are strong, but stock price action lags peers.
Analyst Targets
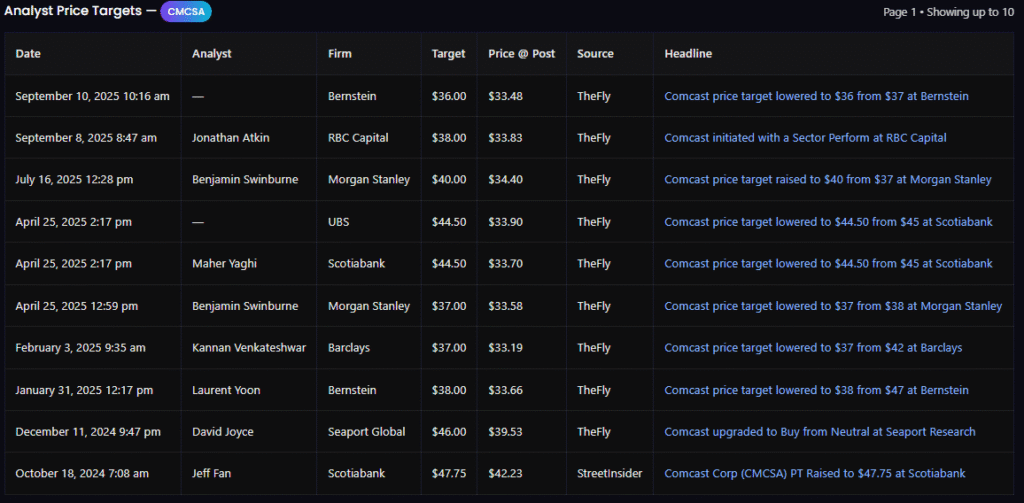
Analyst sentiment is cautious but still supportive:
- Most recent price targets: $36–40
- High-end estimates: $44.50–47.75
- Current price: $30.40
This implies 20–30% upside even at the lower analyst targets, reinforcing the value case.
Insider & Political Trades
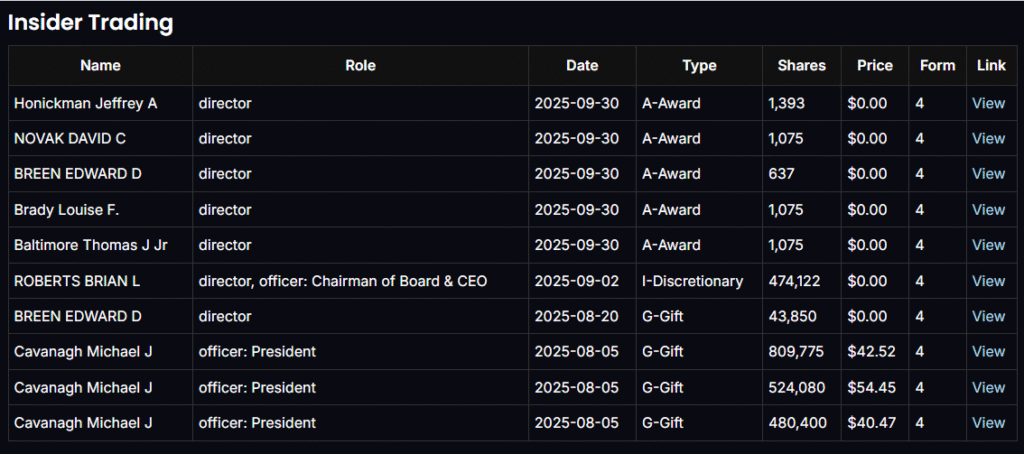
- Insiders: Mostly stock awards and gifts, not active buying.
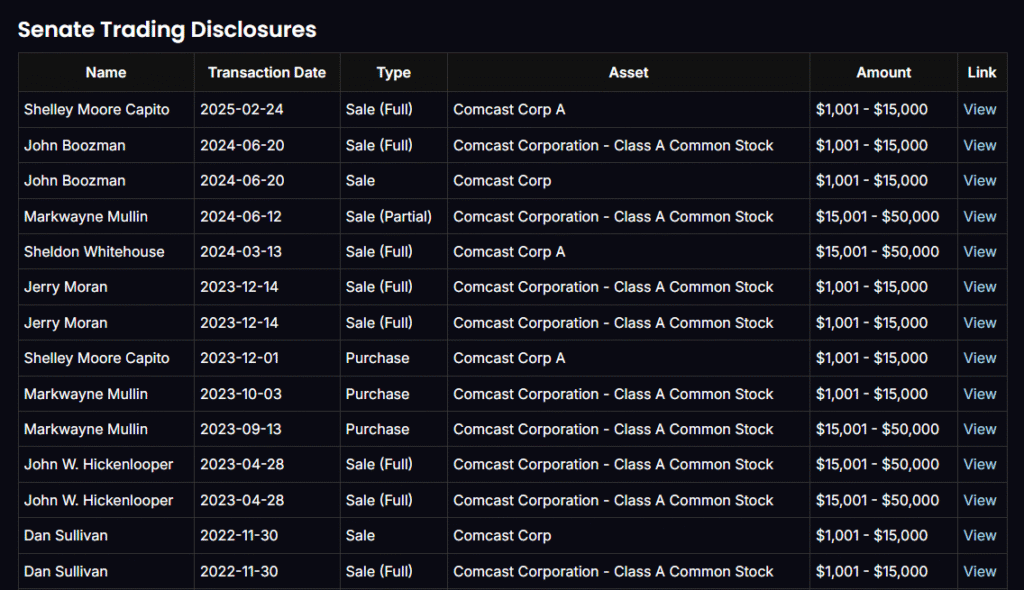
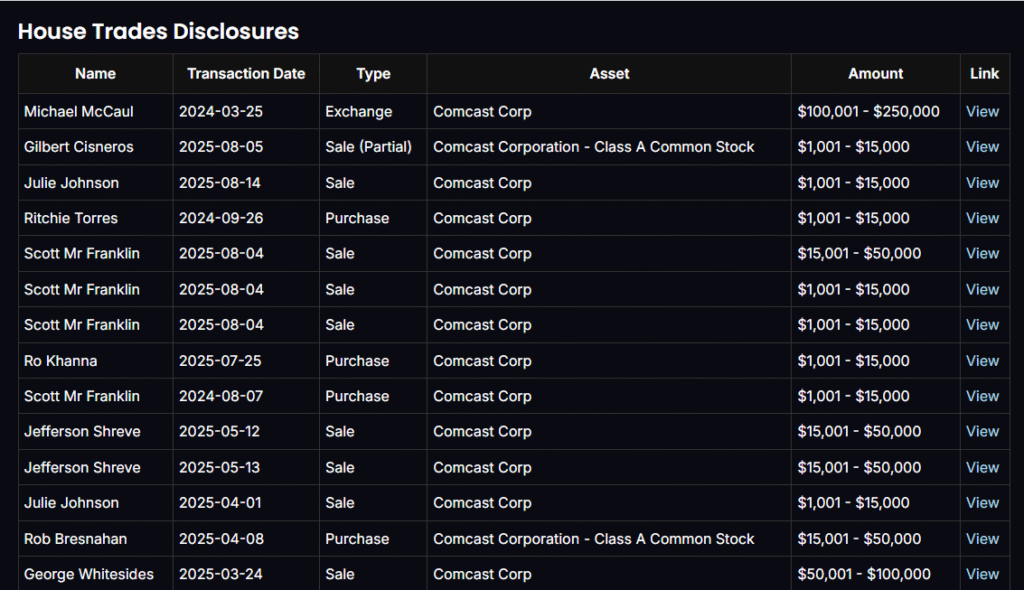
- Senate & House Trades: Predominantly sales in 2024–2025, with a few purchases (Ro Khanna, Markwayne Mullin).
This lack of insider conviction suggests management is cautious, which hedge funds view as a yellow flag.
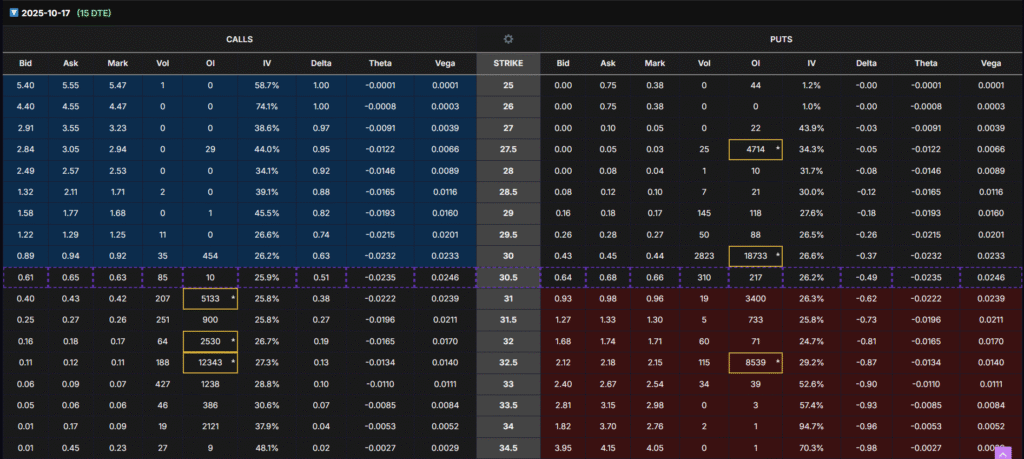
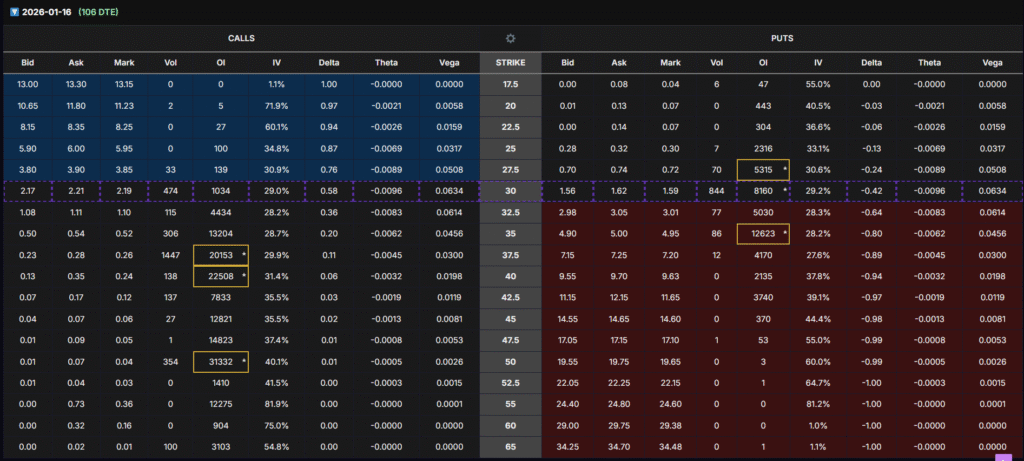
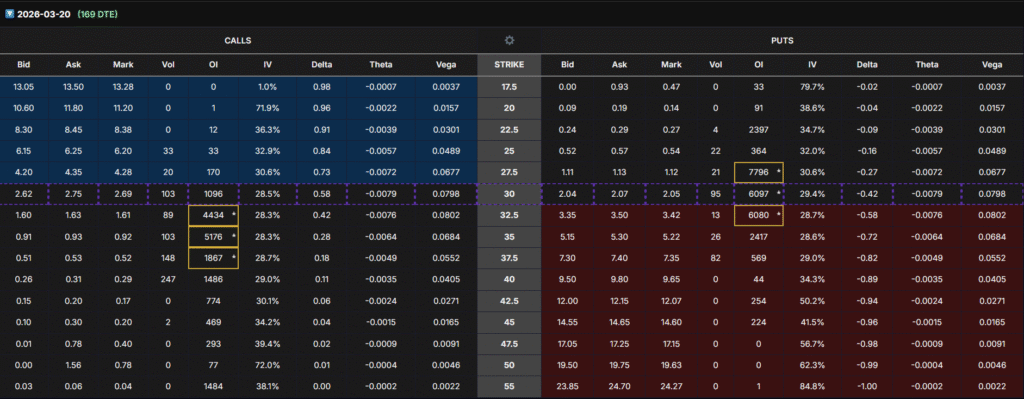
Options Flow (Calls)
Options data shows bullish positioning in long-dated calls:
- Jan 2026 $37.5–50 calls carry massive OI (20K–30K contracts)
- Jan 2027 $40–50 calls show tens of thousands of contracts outstanding
This reflects hedge fund-style setups: buying cheap, long-dated calls to capture vega expansion ahead of catalysts.
🎯 LEAPS Strategy Setup
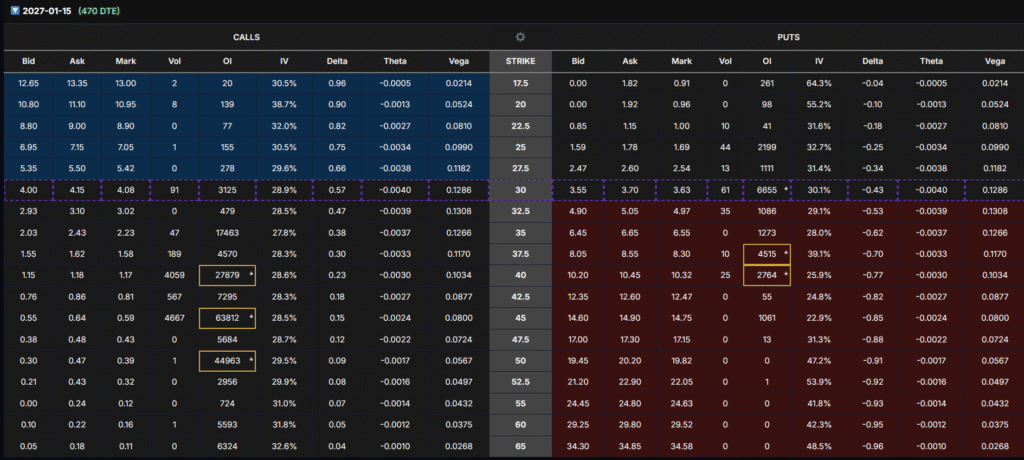
We will use the Jan 15, 2027 $37.5 Calls (470 DTE) for our structured entry:
- Delta: ~0.30 → stronger directional exposure than the $40 strike while still offering leverage.
- Vega: ~0.1170 → excellent sensitivity to implied volatility, allowing us to profit from IV expansion leading into earnings.
- OI: ~4,570 contracts → good liquidity, though slightly lower than $40C.
- Rationale: The $37.5 strike provides a balance between delta exposure and vega sensitivity, making it a strong candidate for buying volatility cheap now and selling later when IV spikes before a catalyst event like earnings.
Catalyst Play
Entering now allows us to benefit from IV/vega expansion leading into earnings. Our plan is to close right before the earnings report to avoid post-earnings IV crush.
- Profit Target: At least 80% return (conservative); stretch goal 100–110%.
- Stock Move Sensitivity: Even a 10% stock move up (~$3) could translate into 3–5x gains on the options due to delta + vega leverage.
📌 Trade Execution Plan – 3 Batch Entry
- Batch 1 – Enter Now: Buy Jan 2027 $40C while options are cheap.
- Batch 2 – Enter Later: When the options price drops -40% to -50% of the options price, add a second batch.
- Batch 3 – Enter Later: When the second batch drops -40% to -50% of the options price, enter the final batch.
⚖️ Risk & Exit Strategy
- Holding Period: Maximum of 2 months. If profits don’t materialize, we roll to a later cycle.
- Partial Profits: If options rise 80%+ right before earnings, close 2/3 of position and let 1/3 ride for potential catalyst upside.
- Risk Control: Allocate only 2% of total portfolio to this trade.
✅ Conclusion
CMCSA is deeply oversold technically but remains fundamentally strong with robust cash flow, high margins, and undervaluation. Analysts still see 20–30% upside, while options flow shows institutional players preparing for a long-term rebound.
Our LEAPS $40 Call strategy positions us to profit primarily from vega expansion and delta leverage — buying cheap volatility now and selling into pre-earnings IV spikes. With a structured 3-batch entry and strict risk control, this trade setup offers attractive asymmetric upside.
⚠️ Disclaimer
This analysis is for educational and informational purposes only and should not be considered financial advice. Options trading carries significant risk, and traders should only allocate a small portion of their portfolio (maximum 2% allocation per trade). Always perform your own due diligence and consult with a financial advisor before executing any trade.