Introduction
Lululemon Athletica (NASDAQ: LULU) has entered a rare moment in its trading history. After years of being one of Wall Street’s premium growth names, the stock now sits at multi-year lows, trading around $167 as of early September 2025. The selloff was triggered by guidance cuts, weak U.S. demand, and tariff headwinds.
Yet, when we overlay the technicals, fundamentals, analyst expectations, and options market activity, an interesting picture emerges: while momentum remains bearish, the long-term setup for investors and options traders may present a high-reward asymmetric opportunity.
Technical Overview
From a technical perspective:
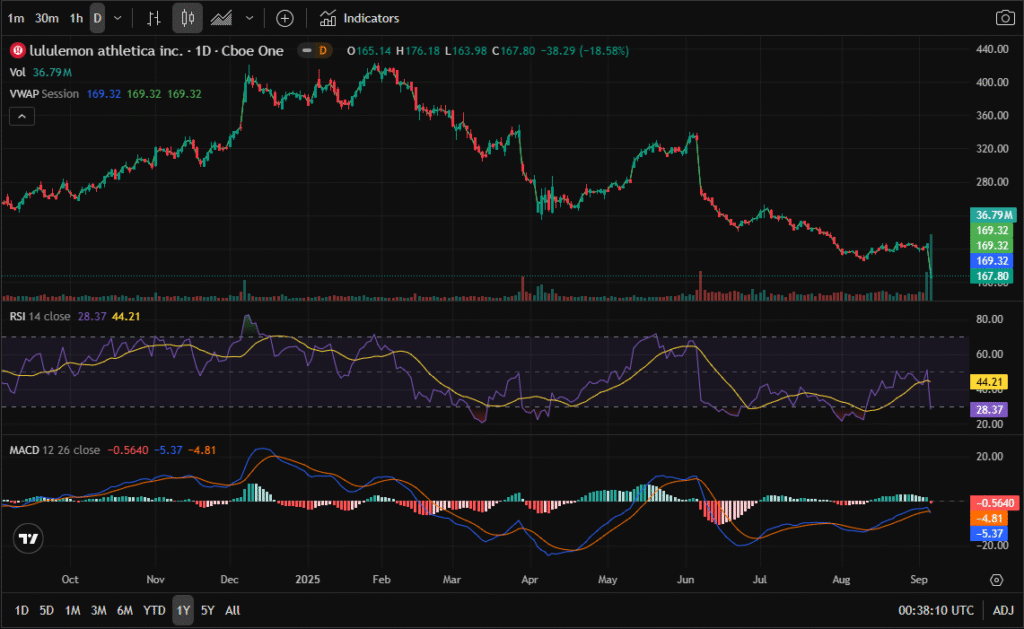
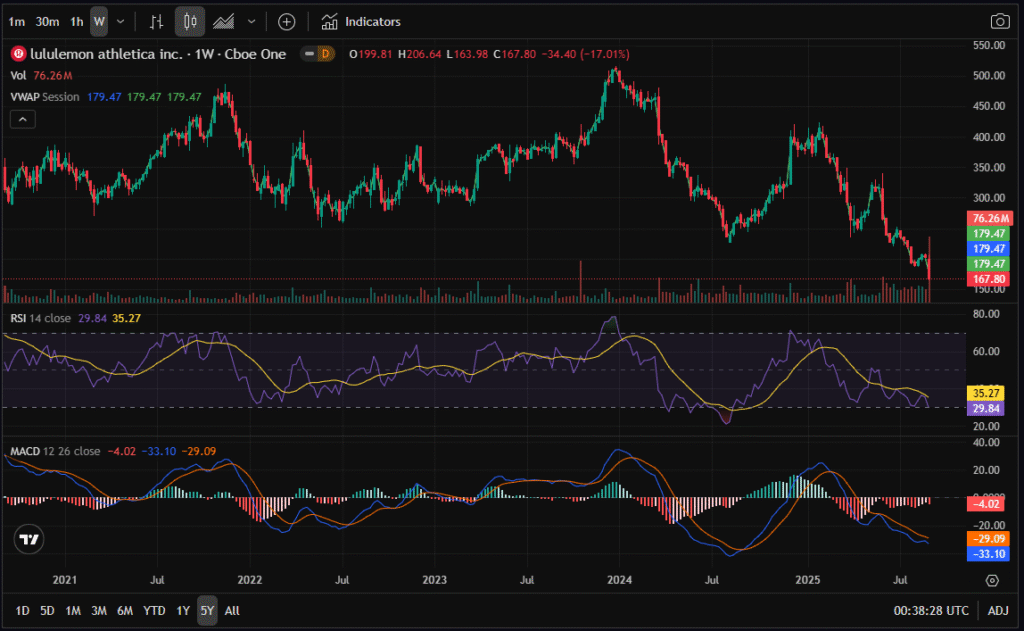
- Price Action: Shares are trading near $167, at both 1-year and 5-year lows. This marks a breakdown through long-standing support zones.
- RSI: At 28 (1 year chart) and 29 (5 year chart), LULU is firmly oversold. Historically, readings below 30 have preceded strong relief rallies, though this is not always an immediate bottom signal.
- MACD: Both daily and weekly MACD lines are below zero and trending downward, confirming bearish momentum. A bullish crossover has not yet formed.
- Volume: Recent sessions have seen volume spikes exceeding 30M shares per day, suggesting capitulation selling. High-volume washouts often precede stabilization.
Conclusion: technically oversold, but no reversal confirmation yet. This places LULU on watchlist for a rebound play.
Fundamental Strength
Despite the stock’s plunge, Lululemon’s financial health remains robust:
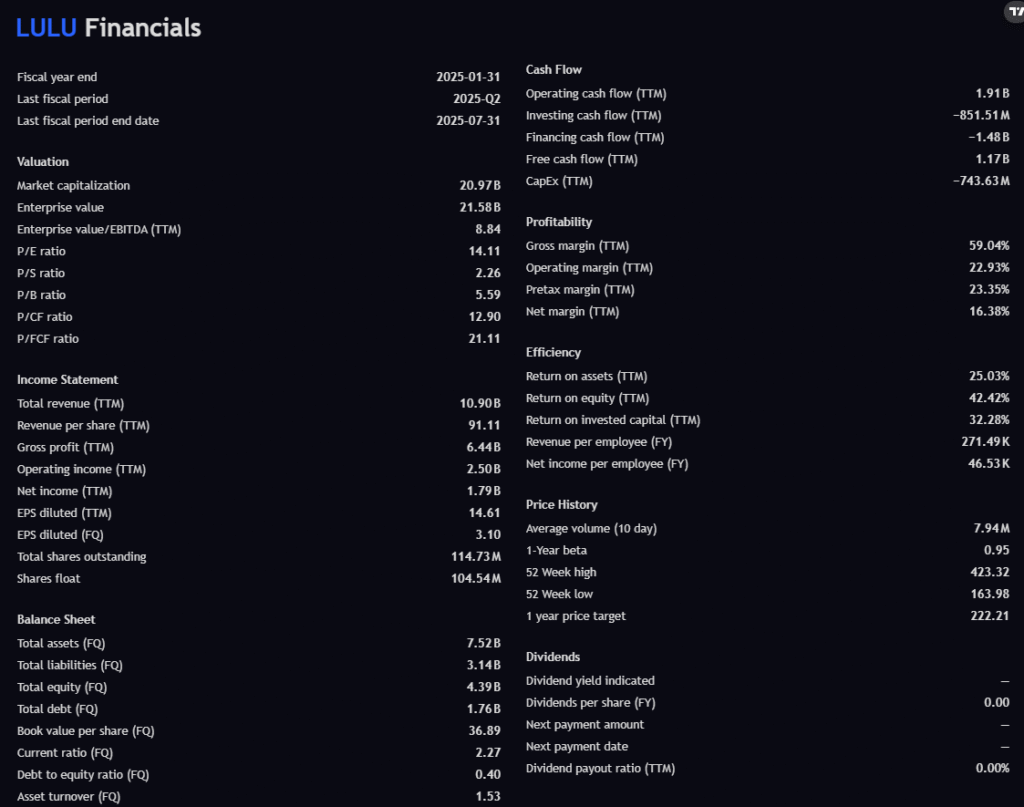
- Revenue (TTM): $10.75B – Still growing, though at a slower pace.
- Gross Margin: 59% – Elite among retailers, reflecting pricing power and brand loyalty.
- Operating Margin: 23.7% / Net Margin: 16.8% – Far stronger than competitors like Nike or Adidas.
- Free Cash Flow: $1.32B – Positive and consistent, giving LULU flexibility for buybacks or expansion.
- Debt/Equity Ratio: 0.40 – Very conservative balance sheet.
- ROE: 42% / ROIC: 33% – Exceptional return metrics, showing efficient capital allocation.
Conclusion: Fundamentally, LULU remains a high-quality company despite cyclical headwinds. The stock is now trading at just 14x earnings, well below its historical 30–40x multiple.
Analyst Sentiment
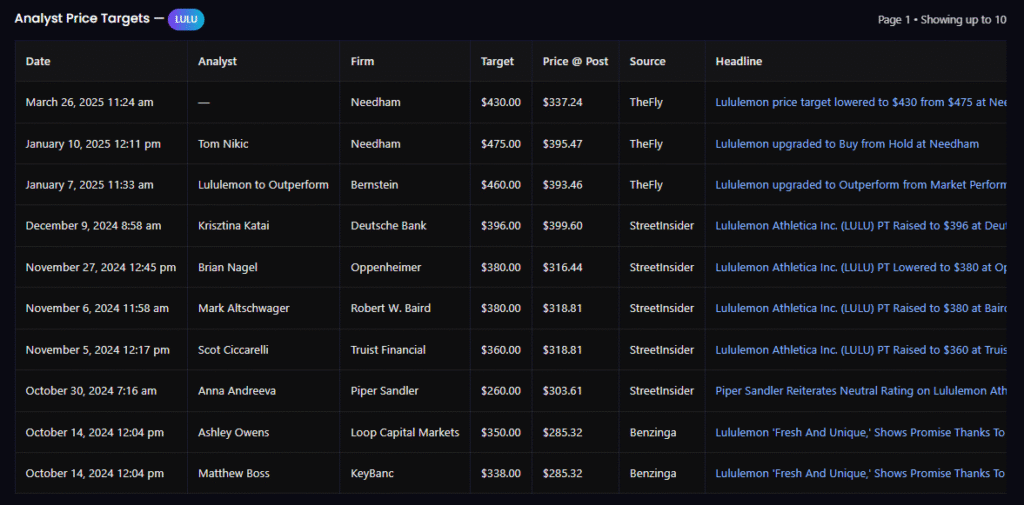
Wall Street analysts remain optimistic compared to current price levels:
- Needham: $430 target (revised down from $475).
- Bernstein: $460 target, upgraded to Outperform.
- Deutsche Bank: $396 target.
- Truist / Baird: $360–$380 targets.
- Piper Sandler (cautious): $260 target.
Median analyst target: ~$373 — representing 120% upside from current levels. Even the most bearish target ($260) implies a 55% rebound potential.
Conclusion: Analysts see LULU as undervalued, but most expect recovery to take time, with U.S. sales headwinds likely persisting into 2026.
Options Market Activity
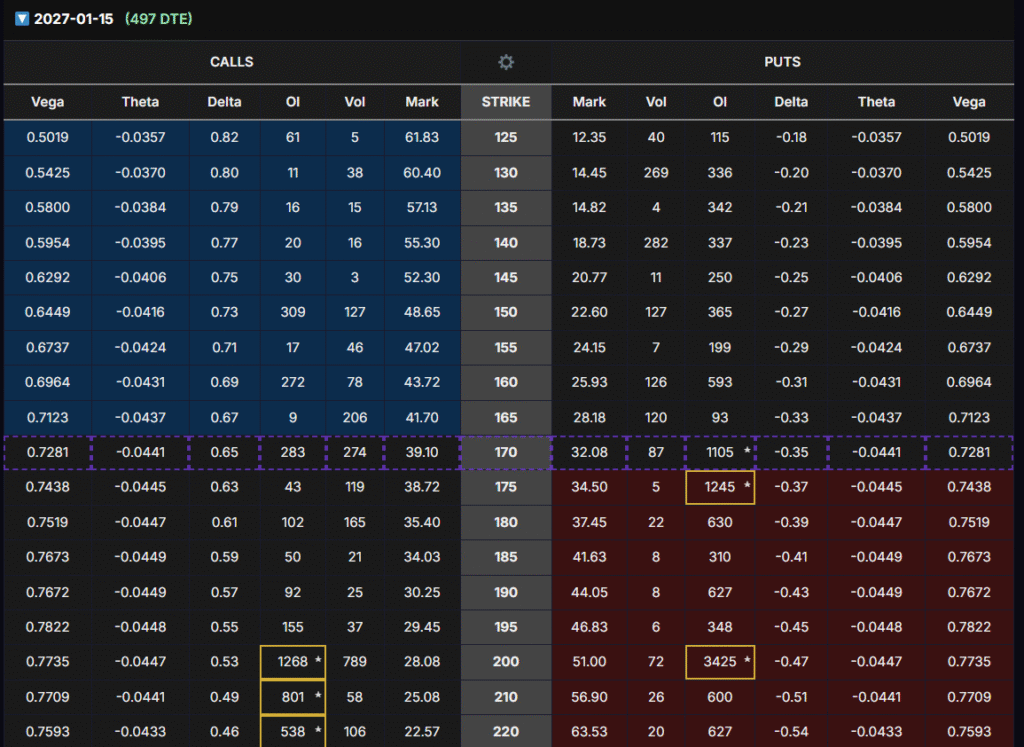
Looking at the Jan 15, 2027 LEAPS chain (497 days to expiration):
- $200 Call:
- Delta: 0.49 → balanced directional exposure.
- Vega: 0.77 → high sensitivity to volatility expansion.
- Theta: –0.044 → minimal time decay.
- Premium: ~$28 ($2,808 per contract).
- OI: 801 → liquid enough for traders.
Why $200? It sits near the psychological battleground level where open interest is high on both calls and puts. In fact, $200 puts show OI over 3,400, meaning institutions are also hedging heavily at this level.
Strategy: Buy the Vega, Sell the Vega
By entering a $200 strike LEAPS call now, traders gain exposure to two profit drivers:
- Delta Upside – if shares rebound toward $190–210, calls gain in intrinsic value.
- Vega Expansion – implied volatility typically rises into earnings or catalysts.
The key is not to hold through earnings (which risks IV crush), but to sell to close before the report. This way, traders benefit from the IV rise without exposure to post-earnings decay.
Risk/Reward Assessment
- Risks:
- LULU continues its downtrend toward $150 or below.
- U.S. sales weakness persists longer than expected.
- Analyst targets get revised further downward.
- Rewards:
- Upside to $200–220 within months could double the value of the LEAPS call.
- Longer-term intrinsic valuations (analyst targets $350–$450) imply the stock is heavily discounted.
Conclusion
Lululemon is in a rare technical and fundamental dislocation. The stock is oversold and trading at valuation multiples not seen in over a decade, despite maintaining elite margins, strong cash flow, and a fortress balance sheet. Analyst consensus suggests substantial upside, though recovery may take until 2026.
For options traders, the $200 Jan 2027 LEAPS call offers an efficient way to play a medium-term rebound. With delta near 0.5 and high vega exposure, the contract allows traders to capitalize on both price recovery and implied volatility expansion before the next earnings report.
In short: LULU is fundamentally strong, technically oversold, and optionable through LEAPS — a high-conviction watchlist candidate for traders looking to position ahead of a potential rebound.
⚠️ Disclaimer: This article is for informational purposes only. No position is currently held in LULU at the time of writing. Options involve significant risk and are not suitable for all investors.