Date: September 3, 2025
Time Horizon: 12–24 Months
Strategy Focus: Dividend Stability + Optional LEAPS
🧱 Technical Analysis
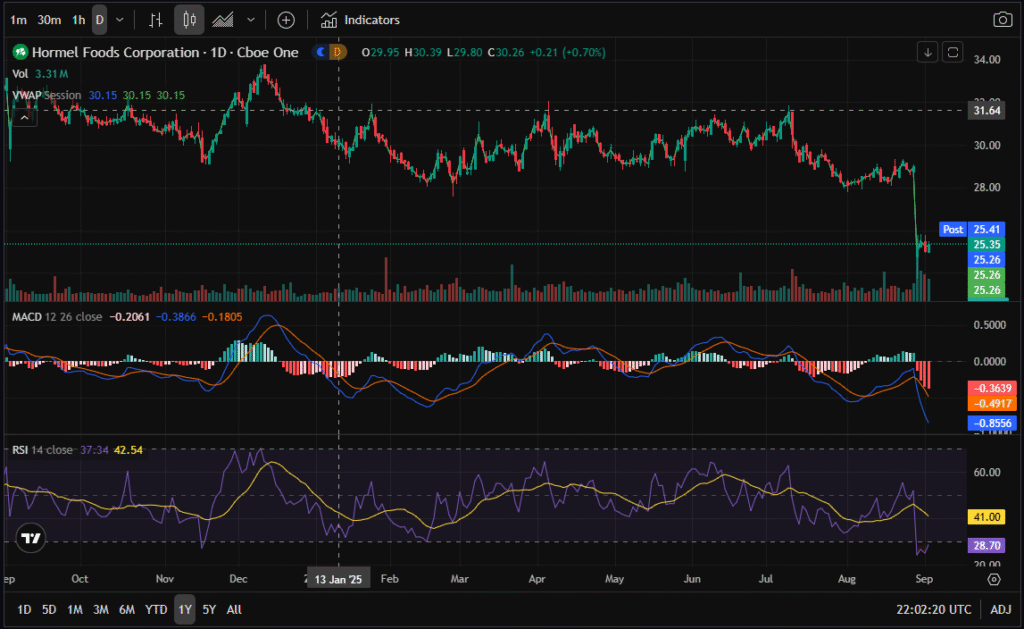
Hormel Foods (HRL) is currently trading at $25.35, which places it at both a 1-year low and a 5-year low. On the daily chart, the Relative Strength Index (RSI) is at 28.7, officially in oversold territory. While oversold conditions can persist in strong downtrends, they often precede short-term relief rallies.
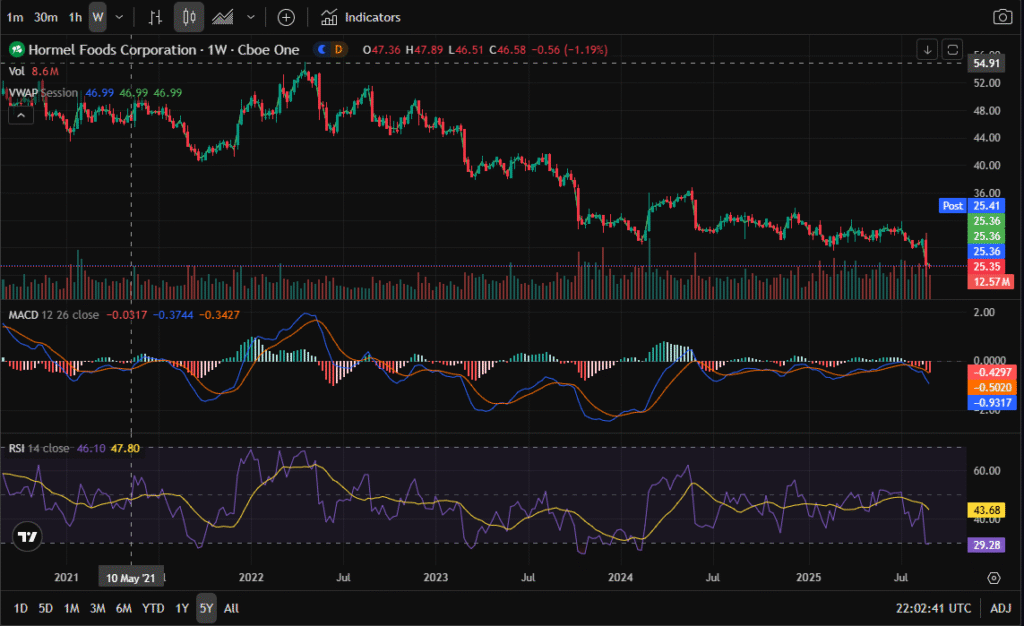
The MACD indicator on both the daily and weekly charts shows a bearish crossover, with the MACD line (blue) crossing below the signal line (orange). The histogram is negative and expanding, reflecting strong downside momentum.
This combination of oversold RSI + bearish MACD paints a picture of a stock under heavy selling pressure, but potentially near exhaustion. The key support zones are $25.00 psychological level and deeper around $23.00–24.00 (a base from 2017–2018). Resistance zones sit around $28.00 and $30.00.
✅ Implication: HRL is technically oversold and testing long-term lows, creating an opportunity for value-oriented investors, but a bottoming signal is still needed.
💵 Fundamental Analysis
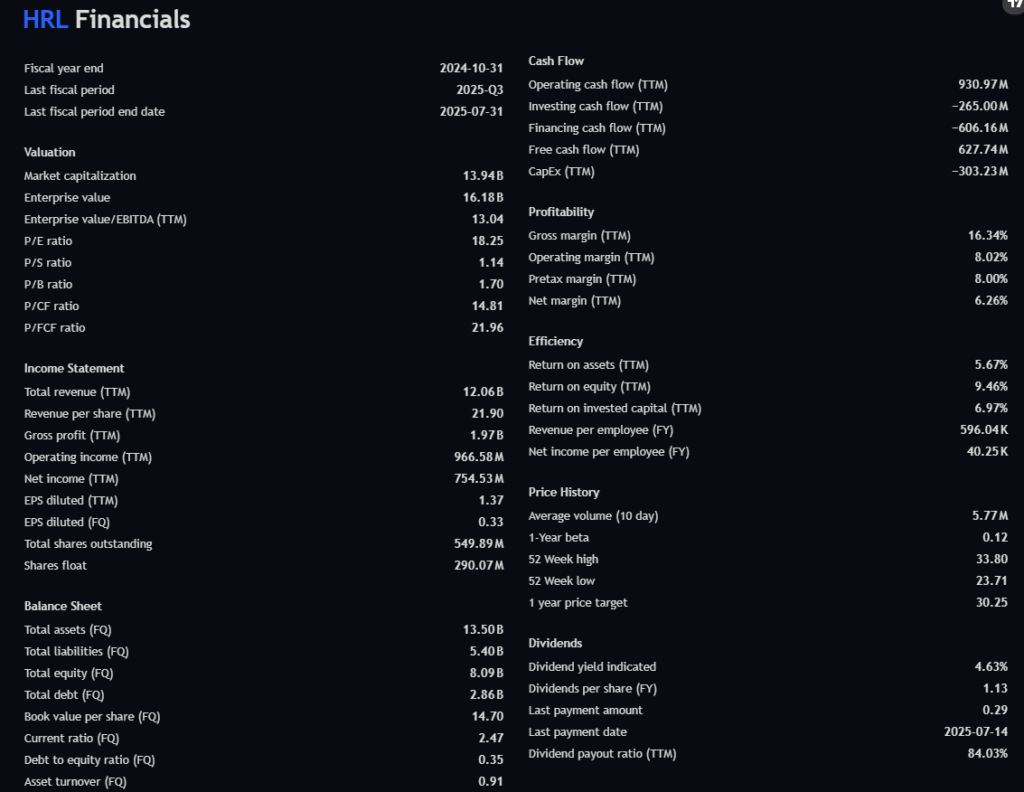
Hormel’s fundamentals highlight stability more than growth.
- Revenue (TTM): $12.06B
- Gross Profit: $1.97B (16.34% margin)
- Operating Income: $966M (8.0% margin)
- Net Income: $755M (6.3% margin)
- EPS (TTM): $1.37
- Free Cash Flow: $628M
The P/E ratio of 18.25 is in line with the consumer staples sector, while the P/S ratio of 1.14 signals fair value. The P/B ratio of 1.70 is not overly stretched.
The balance sheet is a standout strength:
- Debt-to-Equity ratio of 0.35 is very low, giving Hormel a conservative financial profile.
- Current ratio of 2.47 shows strong liquidity.
Hormel’s dividend yield of 4.6% is highly attractive, supported by decades of dividend increases. The payout ratio (84%) is high, but sustainable given steady free cash flow.
✅ Implication: HRL is a defensive cash flow machine with one of the safest balance sheets in its sector, ideal for dividend-focused investors.
📈 Analyst Price Targets
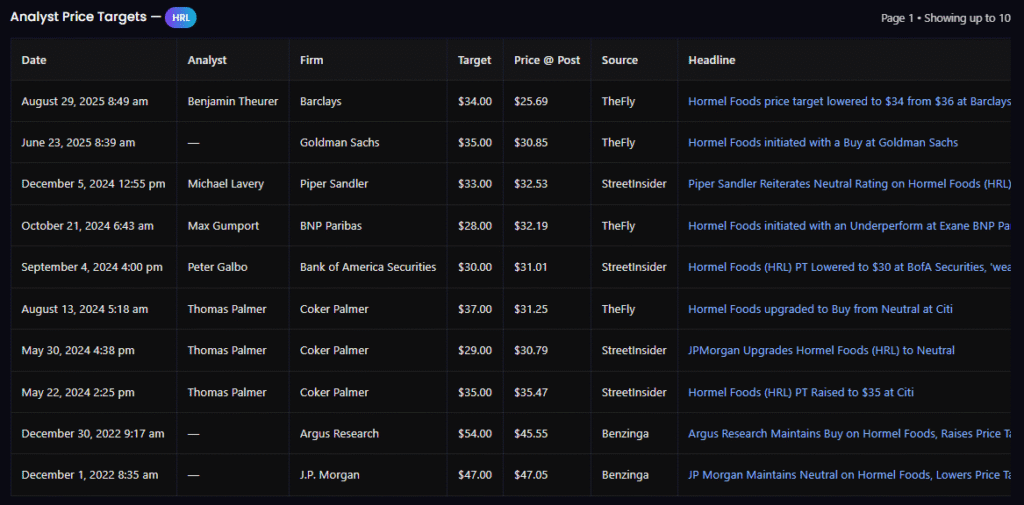
Analysts broadly see Hormel recovering into the $30–35 range, with recent calls including:
- Barclays: $34 (August 2025)
- Goldman Sachs: $35 (June 2025)
- Piper Sandler: $33 (December 2024)
- BofA: $30 (September 2024)
The consensus midpoint is ~$32, representing ~25% upside from the current $25 level. Even the low-end targets ($28) are above today’s price, signaling analysts believe HRL is undervalued at these lows.
📝 Options Chain Analysis (Jan 15, 2027, 499 DTE)
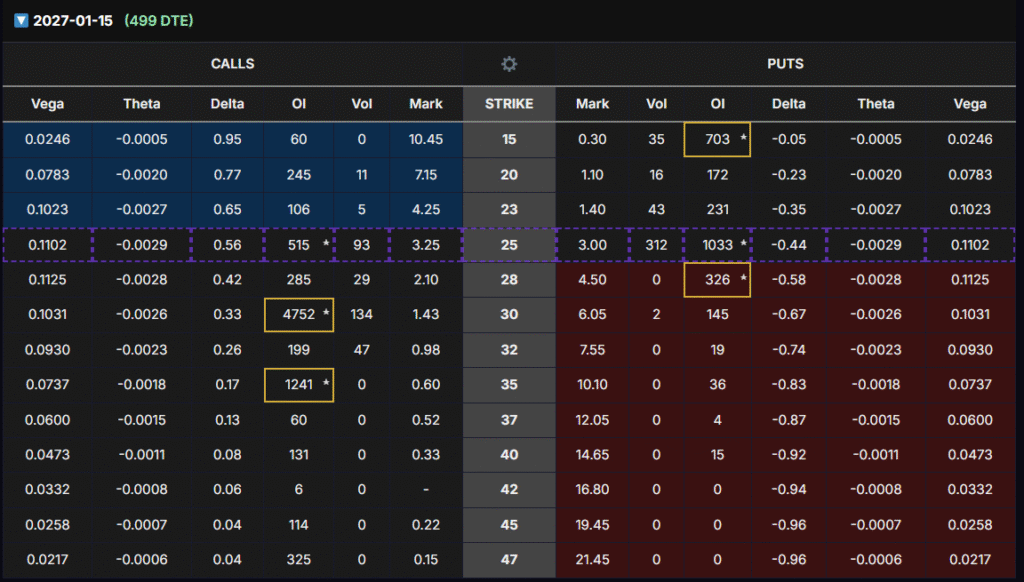
While HRL is more of a dividend stock than a volatility play, the long-dated LEAPS chain still offers interesting setups:
- $25 Strike (ATM): Delta 0.56, Vega 0.1102, Premium $3.25. Safer, stock-like exposure.
- $28 Strike: Delta 0.42, Vega 0.1125 (highest in the chain), Premium $2.10. Balanced and cost-effective.
- $30 Strike: Delta 0.33, Vega 0.1031, Premium $1.43, with massive OI (4,752). More speculative, but very liquid.
👉 The $28 strike stands out as the sweet spot: it offers a balanced delta (~0.4–0.5), the highest vega, and a cheaper premium than ATM. If HRL climbs back to $32–35 as analysts suggest, this strike would yield strong percentage gains.
🧩 Final Thesis
Hormel Foods is not a growth stock like CNH Industrial, but it represents a classic defensive play:
- Oversold technically, trading at 5-year lows.
- Fundamentally sound with strong cash flows and a fortress balance sheet.
- Attractive 4.6% dividend yield from a Dividend King.
- Analysts see 20–40% upside from current levels.
For investors: HRL is a buy-and-hold recession-proof dividend stock at an attractive entry point.
For options traders: HRL is not suited for explosive LEAPS growth, but the $28 Jan 2027 call offers a reasonable way to gain long-term exposure with vega leverage and modest premium cost.
📌 Conclusion: Add HRL to the Dividend Watchlist
Hormel Foods belongs on a defensive dividend watchlist, complementing growth-focused LEAPS setups like CNH Industrial. At current oversold levels, HRL offers both yield stability and a discounted entry point for investors seeking safety in turbulent markets.
[PLACEHOLDER: Payoff Scenarios Chart if added]
⚠️ Disclaimer: This analysis is for informational purposes only. No position is currently held in HRL. Options involve significant risk and may not be suitable for all investors.