📊 NTLA (Intellia Therapeutics) Stock Analysis: Breakdown, Bounce, and Biotech Setup
Based on the 1-year weekly chart for NTLA (Intellia Therapeutics), here’s a comprehensive technical analysis using key indicators visible on the chart and supported by broader context for biotech traders.
🕯️ Price Action & Candlestick Analysis
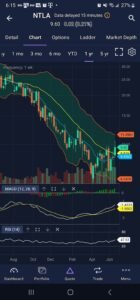
Current Price: $9.60
Trend: Long-term downtrend from over $30 to recent lows near $6.14.
Recent Action: A notable bullish reversal appears to be underway.
After bottoming out at $6.14—aligned with the lower Bollinger Band—NTLA has since bounced upward and crossed above the 20-period EMA. This bullish momentum, after months of selling pressure, may indicate a short-term reversal or at least a relief rally. The candle formations suggest growing demand, and price is now approaching its 20-week SMA midpoint.
📉 Moving Averages Interpretation
Yellow Line (~$8.81): Likely the 20-week or 50-week SMA
Blue Line (~$8.43): Shorter EMA (10- or 20-period)
With price now trading above both moving averages, a bullish crossover on shorter timeframes may be forming. On the daily chart, traders should watch for a golden cross, where a shorter EMA moves above the longer SMA—often viewed as a strong bullish signal in trend reversal setups.
📈 Bollinger Bands Signal Compression Breakout
Bollinger Bands have started to widen after weeks of contraction. Price has broken above the middle band, which typically signals a transition from consolidation to expansion. The next target is the upper band around $11.50, which may act as near-term resistance. A breakout above that could open the path toward the $15 gap-fill zone.
📉 MACD (12, 26, 9) Bullish Crossover
MACD Line: –1.4333
Signal Line: –1.9002
Histogram: Rising into positive territory
The MACD crossover is bullish and is reinforced by growing histogram bars. When the MACD crosses above the signal line and the histogram flips green, it often signals positive price momentum. This supports the bullish interpretation drawn from moving averages and Bollinger Bands.
📊 RSI (14): Climbing Out of Oversold Territory
Current RSI: 47.83
This level reflects neutral momentum, but the RSI is climbing from oversold, meaning buyers are gradually taking control. There’s still room to rise before hitting overbought (>70), giving NTLA space to run in a technical relief rally or possibly a trend change.
Get a better understanding of RSI at Investopedia
🔍 Volume Analysis: Institutional Interest or Short Covering?
Higher-than-average volume accompanying bullish candles is a strong signal of conviction. Volume spikes after long-term downtrends are often early signs of accumulation by institutions or short covering. This confirms that the bounce is not just a technical fluke, but potentially driven by larger participants positioning ahead of a biotech catalyst.
📌 Key Technical Levels to Watch
| Level | Type | Significance |
|---|---|---|
| $6.14 | Support | Lower Bollinger Band / 52-week low |
| $8.81 | Resistance-Turned-Support | SMA zone, now tested from above |
| $9.60 | Current Price | Psychological and trendline level |
| $11.50 | Resistance | Upper Bollinger Band / breakout target |
| $15.00+ | Gap Resistance | Strong resistance and potential LEAPS target |
🧠 Summary & Strategy Outlook
✅ Short-term bullish momentum is building, confirmed by MACD and volume.
✅ Technical breakout underway from base pattern, above EMAs and middle Bollinger Band.
⚠️ However, NTLA remains in a broader downtrend unless it breaks and holds above $12–$15.
📈 This creates an ideal setup for a LEAPS ITM call strategy or bullish swing trade with defined risk.
🚨 Keep watch for biotech news or earnings, which could rapidly accelerate the trend in either direction.
🧩 Additional Consideration
Traders should also monitor biotech sector ETFs like XBI or IBB for broader sentiment, as NTLA often moves in sync with sector-wide momentum. If the biotech index confirms the breakout, it may add confluence to this LEAPS ITM call strategy. Managing position size and avoiding earnings day entries can improve risk-adjusted returns.
Learn more about LEAPS Option Strategy in our Stock Options Education Series!