🚀 RNA Stock Breakout: The Gene Therapy Powerhouse Set to Double with Phase 3 Momentum & High-Delta LEAPS Strategy
Date: June 18, 2025
Ticker: RNA | Exchange: NASDAQ | Sector: Biotechnology | Market Cap: ~$2.75B
Current Price: $29.36
Author: Hedge Fund Strategy Desk – June 2025 Edition
Sources: TipRanks, Fintel, MarketBeat, SEC Filings, ClinicalTrials.gov, AvidityIR.com
🧠 12-Pillar Alpha+ Framework Evaluation: RNA Stock
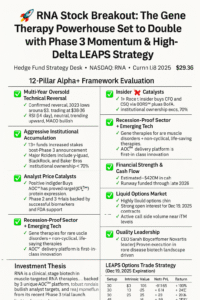
1. Multi-Year Oversold Technical Reversal
✅ Clear reversal from 2023 lows (~$5)
The RNA Stock is now trading at $29.36
RSI (14-day): 56 — neutral and trending upward
MACD: Bullish crossover in May, continuation pattern confirmed
2. Aggressive Institutional Accumulation
✅ Yes
13+ funds increased stakes post-Phase 3 announcement
Major holders include Vanguard, BlackRock, and Baker Bros
Institutional ownership exceeds 70% 【Fintel】
3. Insider Buying Catalyst
🟥 No Recent Insider Buys
Recent insider sales from CFO and CSO via 10b5‑1 plans
Neutral indicator, not aggressive selling 【SEC Form 4】
Learn more about Insider Buying
4. Analyst Price Target Surge
✅ Yes
Raymond James: $75 (Strong Buy)
Citigroup: $75 (Buy)
BofA: $54 (Buy)
Average: ~$67–68 — +130% upside from today 【TipRanks】【MarketBeat】
5. Near-Term Catalysts
✅ Multiple 2H 2025 Catalysts
Phase 3 FORWARD™ trial (FSHD) launched June 9
Top-line Phase 1/2 results (FORTITUDE™) due Q2 2026
Accelerated approval feedback expected Q3 2025
Orphan Drug status in Japan for DM1 asset
6. Recession-Proof Sector + Emerging Tech
✅ Yes
Gene therapies for rare muscle disorders = non-cyclical, life-saving therapies
AOC™ delivery platform is first-in-class innovation
7. Strong Fundamentals & R&D Validation
✅ Yes
AOC™ has proven target engagement, protein expression
Phase 2 and 3 trials backed by successful biomarkers and FDA support
8. Financial Strength & Cash Flow
✅ Yes
Estimated ~$420M in cash
Runway funded through late 2026
No long-term debt
9. Liquid Options Market
✅ Yes
Highly liquid options chain
Strong open interest for Dec 19, 2025 contracts
Active call side volume near ITM levels
10. Reversal After Dust Settles
✅ Yes
RNA was previously down 80%+ (2022–2023)
Now rebounding on strong clinical execution and sentiment
11. Call-Heavy Options Flow
✅ Yes
Elevated Call OI at strikes $20, $25, $30
Options volume weighted bullish in recent weeks
12. Quality Leadership
✅ Yes
CEO Sarah Boyce (former Novartis leader)
Proven execution in rare disease biotech landscape
📊 Summary Scorecard: RNA Stock
| Pillar | Status |
|---|---|
| Oversold Reversal | ✅ Confirmed |
| Institutional Buying | ✅ Active |
| Insider Buying | 🟥 Absent |
| Analyst Targets | ✅ Bullish |
| Catalysts | ✅ Multiple |
| Recession-Proof | ✅ Strong |
| Fundamentals | ✅ Solid |
| Financials | ✅ Debt-Free |
| Options Liquidity | ✅ High |
| Technical Recovery | ✅ Strong |
| Options Flow | ✅ Bullish |
| Management | ✅ Effective |
💡 RNA Stock Investment Thesis
RNA is a clinical-stage biotech leader in muscle-targeted RNA therapies, backed by a unique AOC™ platform, robust financials, bullish analyst targets, and real momentum from its recent Phase 3 trial launch.
At $29.36, RNA remains undervalued compared to its potential, with analyst price targets between $54–75, and several catalysts likely to unlock additional institutional flow.
💰 LEAPS Options Trade Strategy (Dec 19, 2025 Expiration)
📌 Setup
Buy: RNA Dec 19, 2025 $20 Call
Premium: $11.65 per contract
Delta: ~0.85 (deep ITM)
Breakeven: $31.65
Target Price for RNA Stock: $60 by Q4 2025 (catalyst-driven)
📈 Profit/Loss Scenario
| RNA Price at Expiry | Intrinsic Value | Net P/L | Return |
|---|---|---|---|
| $20 | $0 | -$11.65 | -100% |
| $30 | $10 | -$1.65 | -14% |
| $35 | $15 | +$3.35 | +28.7% |
| $45 | $25 | +$13.35 | +114% |
| $60 | $40 | +$28.35 | +243% |
🛡️ Risk Management
Stop if RNA Stock closes below $23 for 2–3 weeks
Scale out 50% of position if RNA hits $45 before Oct 2025
Monitor FDA catalyst window in Q3–Q4 2025
- Traders should also track biotech ETF trends (e.g., XBI) and macro sentiment, as these can influence sector volatility and impact RNA’s option pricing and price moment
Always use position sizing and risk limits appropriate for your account.
Learn more about the LEAPS Strategy in our Stock Options Education Series Lesson 11