NTLA LEAPS ITM CALL Strategy Update #1
🔍 Analyst Sentiment & Price Targets
Benzinga reports 9 analysts covering NTLA: 6 bullish, 2 neutral, 1 moderately bullish. The average 12‑month price target is $33.11, with a range from $10 to $68. However, the average target has been trimmed by 14.8% recently morningstar.com+15benzinga.com+15marketbeat.com+15.
HC Wainwright & Co. reaffirmed a Buy rating with an unchanged $30 target on June 16 gurufocus.com+1benzinga.com+1.
MarketBeat shows a consensus “Moderate Buy,” with an average target of $34.95 (low $7, high $68), implying ~+300% upside ainvest.com+2marketbeat.com+2gurufocus.com+2.
📈 Recent Price Action & Technicals
NTLA is trading between $8.25–$9.11 today, high volatility zone. Volume is elevated at ~4–5 million shares, well above the ~2.8M average finance.yahoo.com+8marketbeat.com+8morningstar.com+8.
StockTradersDaily notes key levels: buy around $7.70 support, next resistance at $8.35 (with breakout target ~$8.98), and intraday resistance at $8.47, stop losses around 8.45–8.68 news.stocktradersdaily.com.
🧬 Fundamental & Trial News: NTLA LEAPS
On June 15, Intellia reported positive three‑year Phase 1 data for its NTLA‑2002 therapy (hereditary angioedema), boosting confidence nasdaq.com+14tipranks.com+14en.wikipedia.org+14.
Earlier signals from TipRanks suggest strong NTLA‑2002 efficacy, prompting H.C. Wainwright’s upgraded Buy stance tipranks.com+1tipranks.com+1.
🚨 Volume & Catalysts
AInvest analysis from early June flagged a ~5.7% spike that lacked technical triggers—driven instead by volume (~1.6M shares, 3× average), possibly due to sector rotation or whispers preceding the trial data ainvest.com.
🧾 Fundamentals at a Glance
Source: TradingView & MarketBeat timothysykes.com+3marketbeat.com+3news.stocktradersdaily.com+3
| Metric | Value |
|---|---|
| Market Cap | ~$861M–$929M |
| YTD Price Change | –26% |
| 1‑Year Price Change | –66% |
| Next Earnings Date | July 31, 2025 |
| Revenue (TTM) | ~$45M |
| Net Income (TTM) | –$481M to –$519M |
| Cash Ratio | ~6.7× |
| Target Price Upside | ~+300% to $35± |
🧭 Summary & Outlook for NTLA LEAPS Strategy
Strong Analyst Conviction: Sustained bullish sentiment with price targets averaging ~$33–35—pointing to substantial upside.
Clinical Catalyst in Play: Positive Phase 1 data for NTLA‑2002 is fueling the narrative, alongside broader CRISPR/biotech revival.
Technical Setup: Standout support at ~$7.70; key resistance at $8.35–8.47, with short-term breakout potential.
Risk Profile: Still early-stage, loss-making, highly volatile (beta ~2.2). Cash buffers help, but speculative biotech nature remains.
✅ What Investors Should Watch
Breakouts above $8.47 on volume—could signal a swing trade with a target near $8.98.
Sustained performance post-data release—especially as NTLA-2002 progresses.
Upcoming earnings (July 31) for updated commercial/revenue guidance.
Downside protection—support near $7.70; a break below could test the next level.
🏁 Final Take: NTLA LEAPS
NTLA is a high-risk, high-reward biotech with core strengths in CRISPR gene editing. With bullish analyst views and phase 1 trial momentum, there’s potential for a significant rebound. But volatility remains high—consider clear entry/exit levels and size positions cautiously.
Here’s a NTLA LEAPS ITM Call Trading Strategy Update for Intellia Therapeutics (NTLA) using the:
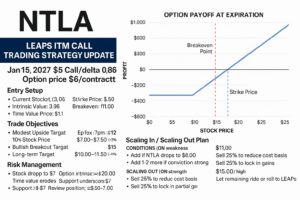
🎯 NTLA Jan 15, 2027 $5 Call
📈 Delta: 0.86
💵 Premium: $6.00 per contract
📅 Days to Expiration: ~578 days
📊 Current Stock Price: $8.96 (as of June 16, 2025)
⚙️ Strategy Thesis: Deep ITM NTLA LEAPS Call (High Delta, High Conviction)
This trade is designed for long-term directional exposure to NTLA LEAPS with significantly less capital than buying shares, but with a stock-like movement due to the high delta (0.86).
📌 Entry Setup
| Parameter | Value |
|---|---|
| Stock Price | $8.96 |
| Strike Price | $5.00 |
| Intrinsic Value | $3.96 |
| Time Value Paid | $2.04 ($6.00 – $3.96) |
| Breakeven Price | $11.00 (Strike + Premium) |
| Delta (approximate) | 0.86 |
| Leverage Multiplier | ~5x compared to buying stock |
📈 Trade Objectives
| Objective | Target Price | Option Value Est. | ROI Est. |
|---|---|---|---|
| Modest Upside Target | $12.00 | ~$7.00–$7.50 | +16%–25% |
| 10% Stock Move (to $9.86) | ~$6.90 | +15% | |
| Bullish Breakout Target | $15.00 | ~$10.00–$11.50 | +66%–91% |
| Long-term Target | $20–$25 | $15–$20 | +150–230% |
📉 Risk Management
| Risk Scenario | Description |
|---|---|
| Stock drops to $7.00 | Option intrinsic ≈ $2.00, time value erodes |
| Support breach <$7 | Review position; possible scale-in at $6.50–$7.00 |
| Stock drops below $5 | Entire option becomes OTM, potential full loss |
You only risk $600 per contract, vs. $896 for 100 shares.
🔁 Scaling In / Scaling Out Plan: NTLA LEAPS
🔹 Scaling In (on weakness)
| Condition | Action |
|---|---|
| NTLA drops to $8.00 | Add more contracts (Avg. cost <$6) |
| NTLA hits $7.00 | Add 1–2 more (if conviction strong) |
| < $6.00 | Reassess fundamentals & support |
🔸 Scaling Out (on strength)
| Trigger Price | Action |
|---|---|
| $11.00 | Sell 25% to reduce cost basis |
| $13.00 | Sell 25% to lock in partial gains |
| $15.00+ | Let remaining ride or roll to higher LEAPS |
✅ Why This Setup Works for NTLA
✅ High Delta (0.86) behaves like owning stock.
✅ Limited downside to premium paid.
✅ Large upside potential if NTLA recovers toward analyst targets ($30–$35).
✅ Positive clinical news and insider/institutional interest recently.
✅ Strong long-term catalyst (CRISPR + NTLA-2002 + pipeline).
🧠 Optional Enhancements: NTLA LEAPS
🔁 Roll Strategy: If NTLA hits $15–$18 by mid-2026, roll to Jan 2029 $10 Calls for extended upside.
🛡️ Hedge Strategy: Pair with short OTM Calls (e.g., Jan 2026 $17) for a diagonal if IV rises.
Learn more about LEAPS strategy from our Stock Options Education Series.