
VIXTradingHub Analysis
📝 VIXTradingHub Analysis
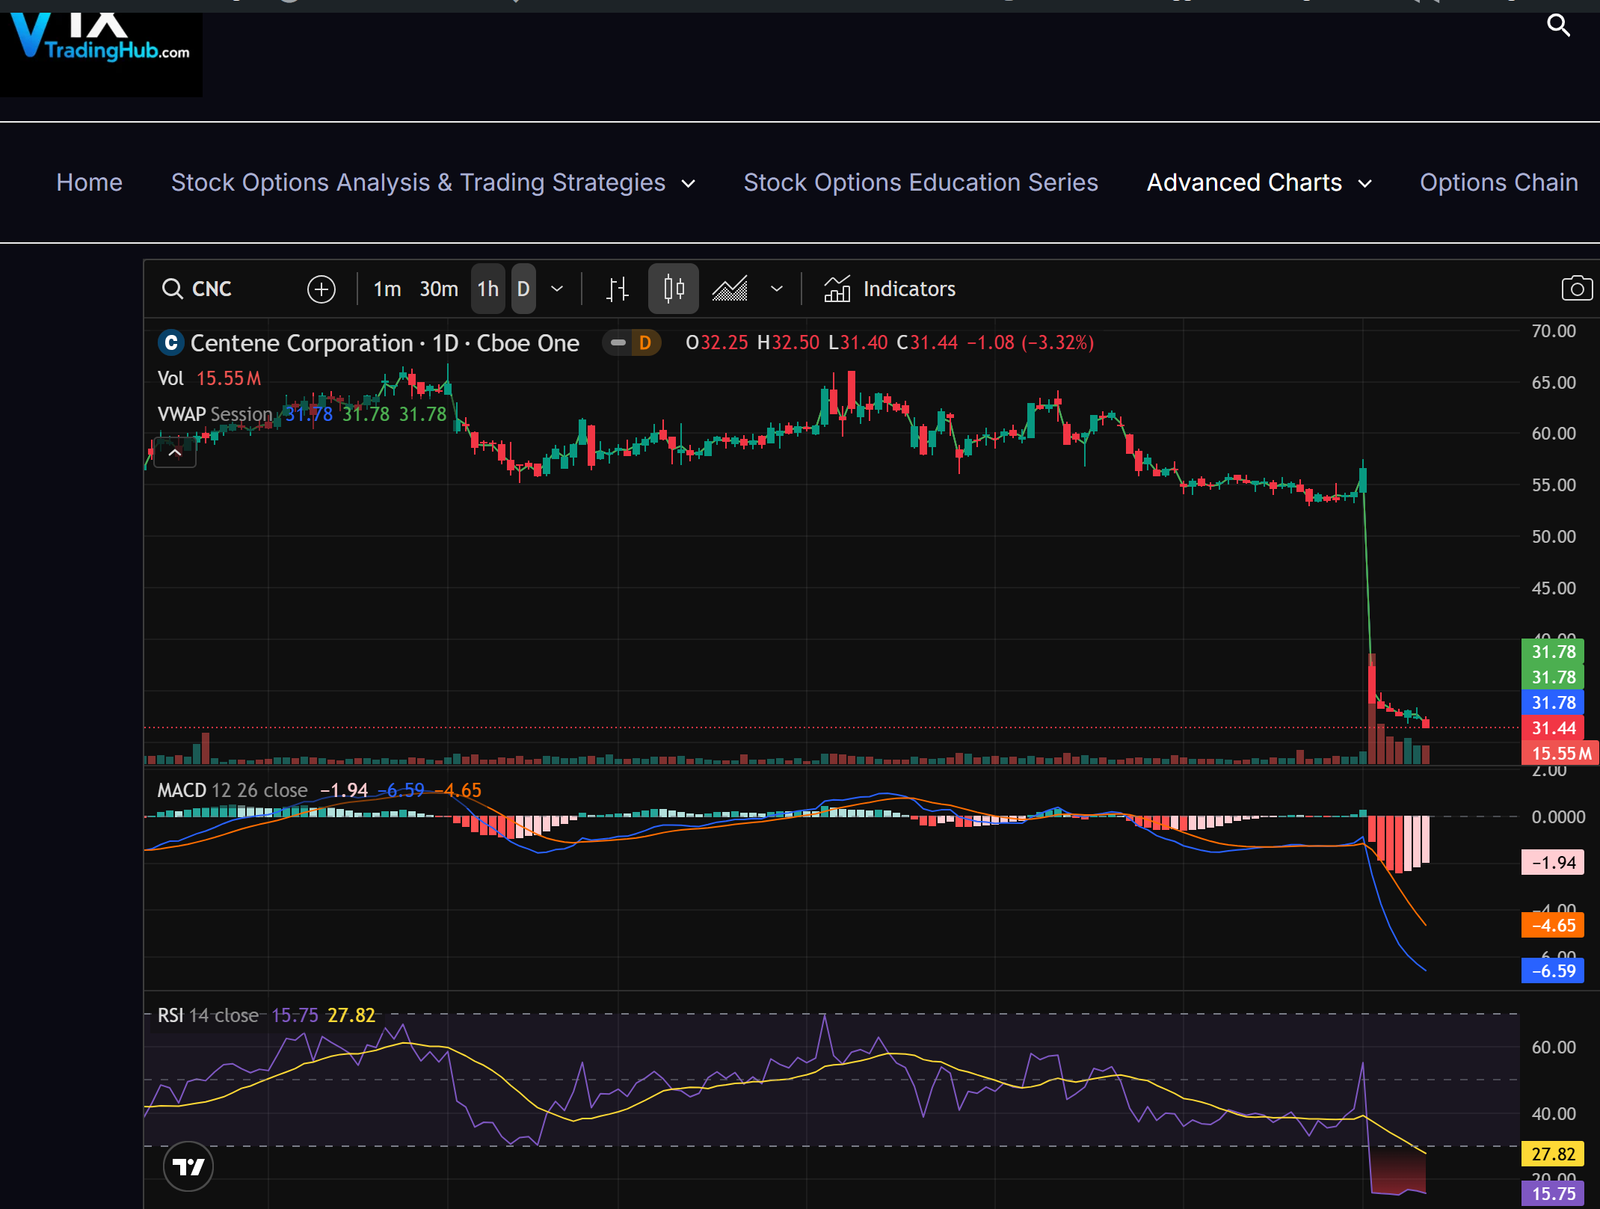
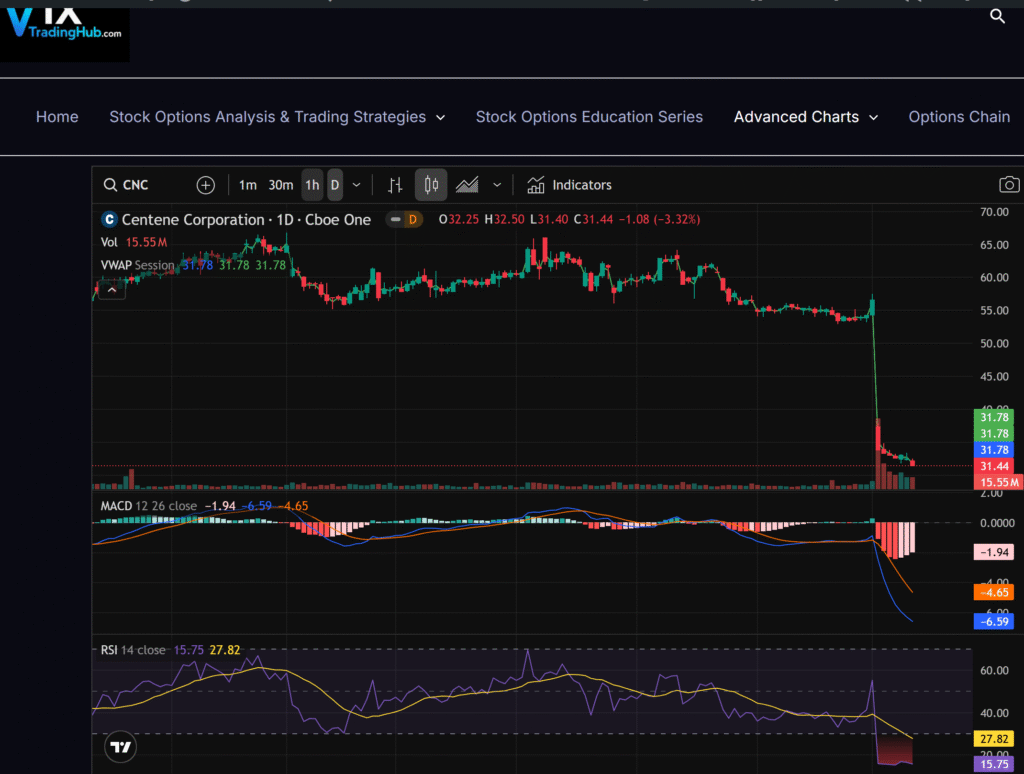
Chart
Financials
News & Opinions
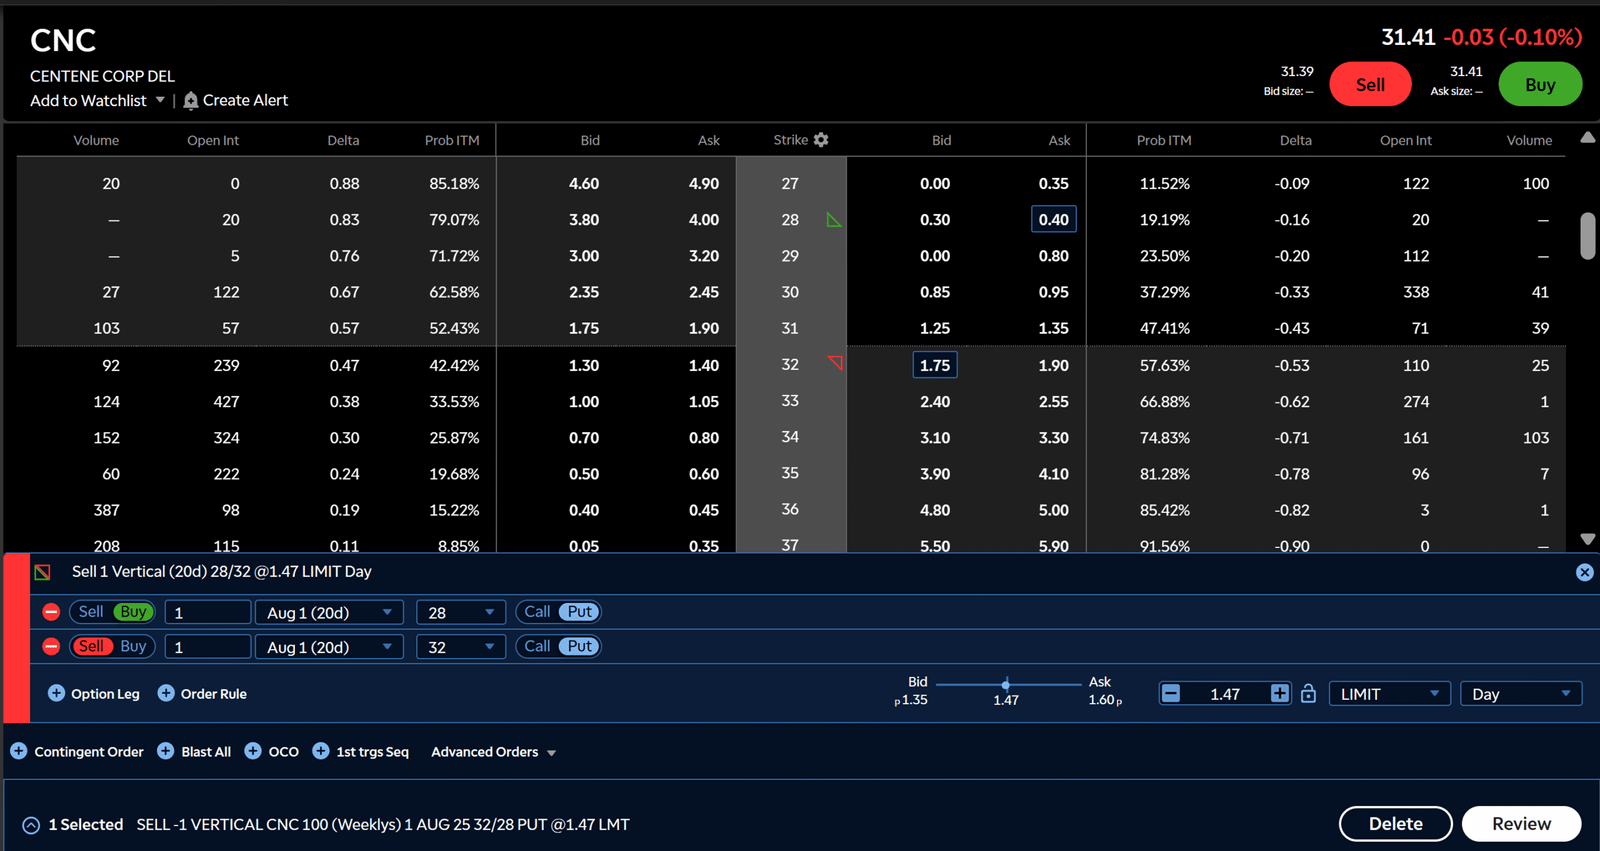
Options Chain
Technical Ratings
📝 VIXTradingHub Analysis