
CNC Stock Option Strategy – Sell Aug 1, 2025 20DTE Iron Condor Based on Max Pain Pinning & Open Interest Analysis – Take profit before July 25 earnings announcement
VIXTradingHub Analysis
📝 VIXTradingHub Analysis
🛠️ CNC Stock Option Strategy – August 1, 2025 Iron Condor Setup
Max Pain Pinning & Open Interest Framework for Traders
📌 What Is a Stock Option Strategy?
A stock option is a financial contract giving the trader the right, but not the obligation, to buy or sell a stock at a specified price. This CNC trade uses a stock option strategy called a Short Iron Condor — a risk-defined, neutral-bias strategy ideal for consolidating markets.
Learn more at Investopedia: Stock Option
📊 Stock Option Market Structure Overview (H2)
Centene Corp (Ticker: CNC) has experienced a major correction, falling from the mid-$50s to the low $30s. It is now stabilizing near $31.44 as of July 12, creating an ideal setup for option premium selling. This technical stabilization is reinforced by institutional open interest at $30P and $34C.
The market also shows a bullish skew, where the Put/Call ratio sits at 0.69, indicating that traders are preparing for a sideways or slightly bullish move — a perfect scenario for deploying a Short Iron Condor.
🔍 Open Interest Analysis for Stock Option Traders (H3)
🔴 Call Resistance Levels
| Strike | OI | Notes |
|---|---|---|
| $33C | 1,262 | Moderate resistance |
| $34C | 3,621 | Key institutional wall |
| $35C | 6,413 | Strongest overhead pressure |
🟢 Put Support Levels
| Strike | OI | Notes |
|---|---|---|
| $30P | 2,211 | Strong technical support |
| $32.5P | 4,630 | Highest put accumulation |
| $27P | 122 | Protective tail hedge |
These levels act as natural stock option barriers for short-term price pinning behavior.
🧲 Max Pain Zone & Stock Option Pinning Logic (H3)
The estimated max pain zone for this option expiration is between $31.50 and $32.00. Large amounts of open interest at these strikes increase the probability of the stock price gravitating toward them into expiration.
Option traders tend to often rely on the Max Pain Theory to identify potential expiration price zones. This theory is used when selling premium-based strategies like iron condors to take advantage of time decay and price magnet effects.
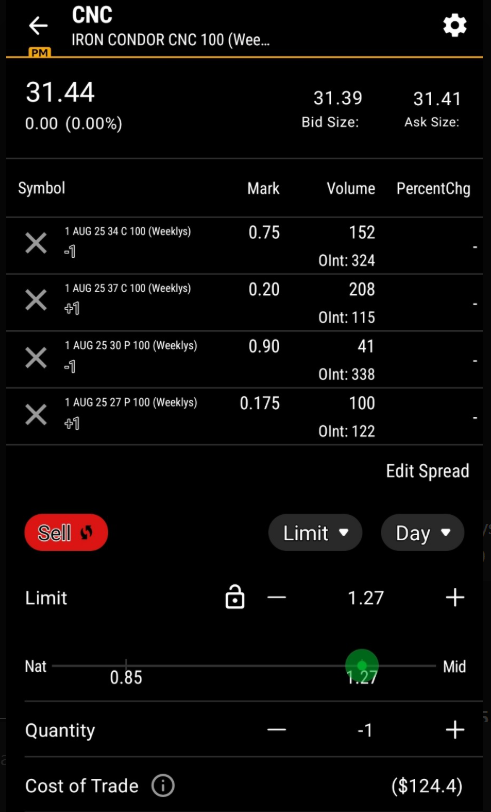
📈 Short Iron Condor Stock Option Strategy Breakdown (H2)
| Leg | Action | Strike | Mark |
|---|---|---|---|
| Short Call | Sell | $34C | $0.75 |
| Long Call | Buy | $37C | $0.20 |
| Short Put | Sell | $30P | $0.90 |
| Long Put | Buy | $27P | $0.175 |
For more on how to construct this strategy, visit our Iron Condor Beginner’s Guide.
📊 Stock Option Trade Metrics (H3)
| Metric | Value |
|---|---|
| Net Credit | $1.275 |
| Max Risk | $1.725 |
| Reward/Risk | 0.74 |
| Breakeven Range | $28.725 – $35.275 |
| Max Profit Zone | $30 – $34 |
| POP (Win Rate) | ~55–60% |
| Theta Positive? | ✅ Yes (20 DTE advantage) |
✅ Why This Stock Option Strategy Works (H2)
-
🎯 Pinning Behavior: Strong open interest levels guide price to a narrow range
-
🔒 Defined Risk: Max risk = $1.725 per contract with favorable credit
-
📉 IV Control: Implied volatility is muted, making premium fair and decay efficient
-
⏳ Time-Based Edge: 20 DTE hits the “theta sweet spot” for sellers
-
💹 Probability: >50% win rate when exiting early at 50–70% max profit
🧠 Risk Plan for This Option Play (H3)
-
Take profits early at 50–70% of max credit
-
Set alerts around $29 and $33.75 as warning zones
-
Avoid holding past 2 DTE to reduce gamma risk before earnings
-
Adjust or roll if price breaches outer wings ($30P or $34C)
🧩 Internal Resource:
Explore our complete Stock Option Education Center to master strategies like Iron Condors, Credit Spreads, and LEAPS.
🔚 Final Summary: CNC Stock Option Play (H2)
This 20 DTE CNC option strategy leverages real institutional positioning and technical structure to extract income in a low-risk, range-bound scenario. With earnings on the horizon, this setup avoids binary risk while benefiting from time decay and open interest-driven pinning.
For options traders seeking a smart, calculated approach to generate premium in July, this setup is a standout.
Chart
Financials
💰 5-Year Financial Overview for CNC
| Metric | 2024 | 2023 | 2022 | 2021 | 2020 |
|---|---|---|---|---|---|
| Revenue | 163,071,000,000 | 153,999,000,000 | 144,547,000,000 | 125,982,000,000 | 111,115,000,000 |
| Cost of Revenue | 146,242,000,000 | 136,684,000,000 | 127,891,000,000 | 111,783,000,000 | 95,899,000,000 |
| Gross Profit | 16,829,000,000 | 17,315,000,000 | 16,656,000,000 | 14,199,000,000 | 15,216,000,000 |
| Operating Expense | 13,654,000,000 | 14,385,000,000 | 15,338,000,000 | 12,415,000,000 | 12,134,000,000 |
| Operating Income | 3,175,000,000 | 2,930,000,000 | 1,318,000,000 | 1,784,000,000 | 3,082,000,000 |
| Net Income | 3,305,000,000 | 2,702,000,000 | 1,202,000,000 | 1,347,000,000 | 1,808,000,000 |
| EPS (Diluted) | 6 | 5 | 2 | 2 | 3 |
| EBITDA | 6,200,000,000 | 5,616,000,000 | 4,058,000,000 | 3,813,000,000 | 4,760,000,000 |
| EBIT | - | - | - | - | - |
| Tax Provision | 963,000,000 | 899,000,000 | 760,000,000 | 477,000,000 | 979,000,000 |
| Interest Income | 0 | 0 | 0 | 0 | 0 |
| Interest Expense | 702,000,000 | 725,000,000 | 665,000,000 | 665,000,000 | 728,000,000 |
| Total Expenses | - | - | - | - | - |
| Basic Shares Outstanding | 521,790,000 | 543,319,000 | 575,191,000 | 582,832,000 | 570,722,000 |
| Diluted Shares Outstanding | 523,744,000 | 545,704,000 | 582,040,000 | 590,516,000 | 579,135,000 |
News & Opinions
🧠 Analysis & Opinions on CNC
- ROSEN, A LEADING, LONGSTANDING, AND TOP RANKED FIRM, Encourages Centene Corporation Investors to Secure Counsel Before Important Deadline in Securities Class Action - CNC
markets.businessinsider.com • Jul 26, 2025 - Oscar Health’s Selloff May Be Final Wave in Bullish Elliott Cycle
investing.com • Jul 25, 2025 - Centene Stock Up 5% After First Loss In 13 Years, Bullish Guidance
forbes.com • Jul 25, 2025
Options Chain
Technical Ratings
📊 Technical Analysis Overview
Auto-loaded insights for today’s featured stock
Each Daily Stock Pick comes with a built-in Technical Analysis Widget, giving you a fast, visual snapshot of the current market sentiment—based on real-time data.
🔎 What You’ll See:
Overall Signal:
A summary at the top:
✅ Strong Buy, 📈 Buy, ⚖️ Neutral, 📉 Sell, or ❌ Strong SellTimeframes:
Switch between views (1min, 15min, 1hr, Daily, Weekly) to match your trading style—short-term or long-term.Breakdown of Indicators:
Moving Averages – trend-following tools
Oscillators – momentum indicators like RSI & MACD
Pivots – support and resistance levels
💡 How to Use It:
This widget helps confirm or challenge your trading bias. Use it together with:
Our price targets
Options flow & volatility analysis
Institutional and insider sentiment
📝 VIXTradingHub Analysis
🛠️ CNC Stock Option Strategy – August 1, 2025 Iron Condor Setup
Max Pain Pinning & Open Interest Framework for Traders
📌 What Is a Stock Option Strategy?
A stock option is a financial contract giving the trader the right, but not the obligation, to buy or sell a stock at a specified price. This CNC trade uses a stock option strategy called a Short Iron Condor — a risk-defined, neutral-bias strategy ideal for consolidating markets.
Learn more at Investopedia: Stock Option
📊 Stock Option Market Structure Overview (H2)
Centene Corp (Ticker: CNC) has experienced a major correction, falling from the mid-$50s to the low $30s. It is now stabilizing near $31.44 as of July 12, creating an ideal setup for option premium selling. This technical stabilization is reinforced by institutional open interest at $30P and $34C.
The market also shows a bullish skew, where the Put/Call ratio sits at 0.69, indicating that traders are preparing for a sideways or slightly bullish move — a perfect scenario for deploying a Short Iron Condor.
🔍 Open Interest Analysis for Stock Option Traders (H3)
🔴 Call Resistance Levels
| Strike | OI | Notes |
|---|---|---|
| $33C | 1,262 | Moderate resistance |
| $34C | 3,621 | Key institutional wall |
| $35C | 6,413 | Strongest overhead pressure |
🟢 Put Support Levels
| Strike | OI | Notes |
|---|---|---|
| $30P | 2,211 | Strong technical support |
| $32.5P | 4,630 | Highest put accumulation |
| $27P | 122 | Protective tail hedge |
These levels act as natural stock option barriers for short-term price pinning behavior.
🧲 Max Pain Zone & Stock Option Pinning Logic (H3)
The estimated max pain zone for this option expiration is between $31.50 and $32.00. Large amounts of open interest at these strikes increase the probability of the stock price gravitating toward them into expiration.
Option traders tend to often rely on the Max Pain Theory to identify potential expiration price zones. This theory is used when selling premium-based strategies like iron condors to take advantage of time decay and price magnet effects.
📈 Short Iron Condor Stock Option Strategy Breakdown (H2)
| Leg | Action | Strike | Mark |
|---|---|---|---|
| Short Call | Sell | $34C | $0.75 |
| Long Call | Buy | $37C | $0.20 |
| Short Put | Sell | $30P | $0.90 |
| Long Put | Buy | $27P | $0.175 |
For more on how to construct this strategy, visit our Iron Condor Beginner’s Guide.
📊 Stock Option Trade Metrics (H3)
| Metric | Value |
|---|---|
| Net Credit | $1.275 |
| Max Risk | $1.725 |
| Reward/Risk | 0.74 |
| Breakeven Range | $28.725 – $35.275 |
| Max Profit Zone | $30 – $34 |
| POP (Win Rate) | ~55–60% |
| Theta Positive? | ✅ Yes (20 DTE advantage) |
✅ Why This Stock Option Strategy Works (H2)
-
🎯 Pinning Behavior: Strong open interest levels guide price to a narrow range
-
🔒 Defined Risk: Max risk = $1.725 per contract with favorable credit
-
📉 IV Control: Implied volatility is muted, making premium fair and decay efficient
-
⏳ Time-Based Edge: 20 DTE hits the “theta sweet spot” for sellers
-
💹 Probability: >50% win rate when exiting early at 50–70% max profit
🧠 Risk Plan for This Option Play (H3)
-
Take profits early at 50–70% of max credit
-
Set alerts around $29 and $33.75 as warning zones
-
Avoid holding past 2 DTE to reduce gamma risk before earnings
-
Adjust or roll if price breaches outer wings ($30P or $34C)
🧩 Internal Resource:
Explore our complete Stock Option Education Center to master strategies like Iron Condors, Credit Spreads, and LEAPS.
🔚 Final Summary: CNC Stock Option Play (H2)
This 20 DTE CNC option strategy leverages real institutional positioning and technical structure to extract income in a low-risk, range-bound scenario. With earnings on the horizon, this setup avoids binary risk while benefiting from time decay and open interest-driven pinning.
For options traders seeking a smart, calculated approach to generate premium in July, this setup is a standout.
💰 5-Year Financial Overview for CNC
| Metric | 2024 | 2023 | 2022 | 2021 | 2020 |
|---|---|---|---|---|---|
| Revenue | 163,071,000,000 | 153,999,000,000 | 144,547,000,000 | 125,982,000,000 | 111,115,000,000 |
| Cost of Revenue | 146,242,000,000 | 136,684,000,000 | 127,891,000,000 | 111,783,000,000 | 95,899,000,000 |
| Gross Profit | 16,829,000,000 | 17,315,000,000 | 16,656,000,000 | 14,199,000,000 | 15,216,000,000 |
| Operating Expense | 13,654,000,000 | 14,385,000,000 | 15,338,000,000 | 12,415,000,000 | 12,134,000,000 |
| Operating Income | 3,175,000,000 | 2,930,000,000 | 1,318,000,000 | 1,784,000,000 | 3,082,000,000 |
| Net Income | 3,305,000,000 | 2,702,000,000 | 1,202,000,000 | 1,347,000,000 | 1,808,000,000 |
| EPS (Diluted) | 6 | 5 | 2 | 2 | 3 |
| EBITDA | 6,200,000,000 | 5,616,000,000 | 4,058,000,000 | 3,813,000,000 | 4,760,000,000 |
| EBIT | - | - | - | - | - |
| Tax Provision | 963,000,000 | 899,000,000 | 760,000,000 | 477,000,000 | 979,000,000 |
| Interest Income | 0 | 0 | 0 | 0 | 0 |
| Interest Expense | 702,000,000 | 725,000,000 | 665,000,000 | 665,000,000 | 728,000,000 |
| Total Expenses | - | - | - | - | - |
| Basic Shares Outstanding | 521,790,000 | 543,319,000 | 575,191,000 | 582,832,000 | 570,722,000 |
| Diluted Shares Outstanding | 523,744,000 | 545,704,000 | 582,040,000 | 590,516,000 | 579,135,000 |
🧠 Analysis & Opinions on CNC
- ROSEN, A LEADING, LONGSTANDING, AND TOP RANKED FIRM, Encourages Centene Corporation Investors to Secure Counsel Before Important Deadline in Securities Class Action - CNC
markets.businessinsider.com • Jul 26, 2025 - Oscar Health’s Selloff May Be Final Wave in Bullish Elliott Cycle
investing.com • Jul 25, 2025 - Centene Stock Up 5% After First Loss In 13 Years, Bullish Guidance
forbes.com • Jul 25, 2025
📊 Technical Analysis Overview
Auto-loaded insights for today’s featured stock
Each Daily Stock Pick comes with a built-in Technical Analysis Widget, giving you a fast, visual snapshot of the current market sentiment—based on real-time data.
🔎 What You’ll See:
Overall Signal:
A summary at the top:
✅ Strong Buy, 📈 Buy, ⚖️ Neutral, 📉 Sell, or ❌ Strong SellTimeframes:
Switch between views (1min, 15min, 1hr, Daily, Weekly) to match your trading style—short-term or long-term.Breakdown of Indicators:
Moving Averages – trend-following tools
Oscillators – momentum indicators like RSI & MACD
Pivots – support and resistance levels
💡 How to Use It:
This widget helps confirm or challenge your trading bias. Use it together with:
Our price targets
Options flow & volatility analysis
Institutional and insider sentiment
Options Chain
Select an expiration date to expand for table with strikes, greeks, and mark.
Join the Early Access List
“Get exclusive updates and launch bonuses.”