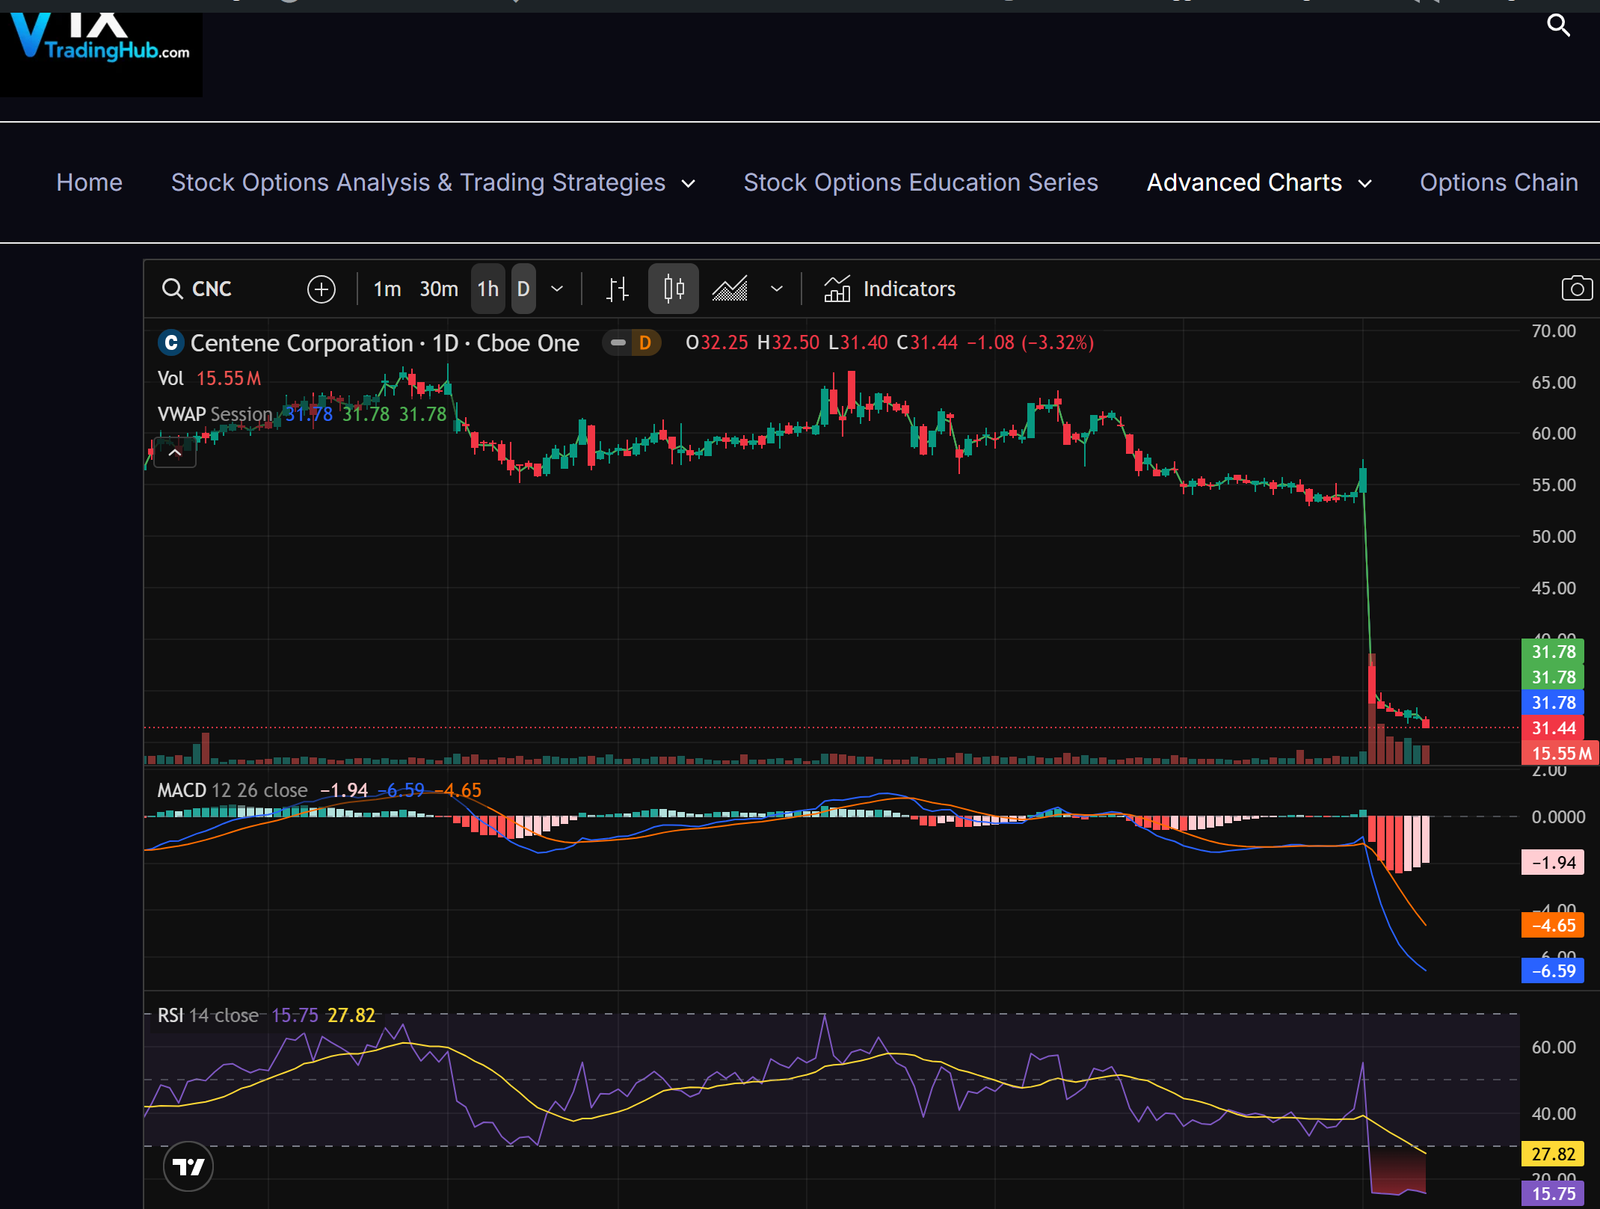
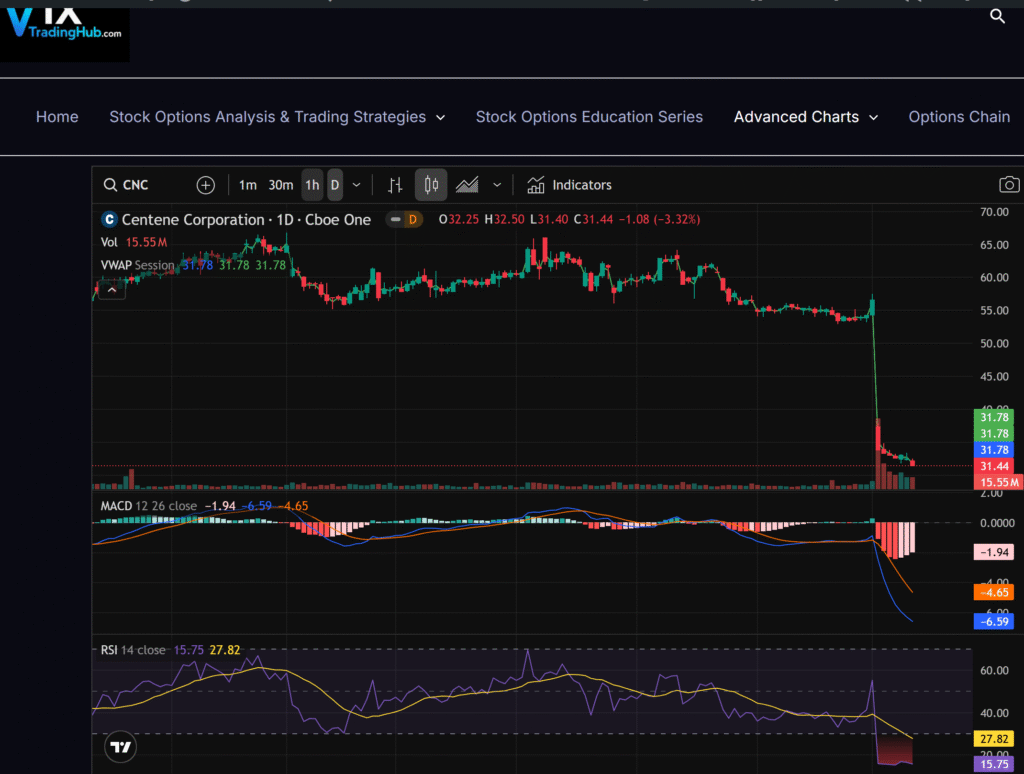
Powerful 1 Year Technical Analysis of CNC Chart with RSI, MACD & Candlesticks
Chart
Financials
💰 5-Year Financial Overview for CNC
| Metric | 2024 | 2023 | 2022 | 2021 | 2020 |
|---|---|---|---|---|---|
| Revenue | 163,071,000,000 | 153,999,000,000 | 144,547,000,000 | 125,982,000,000 | 111,115,000,000 |
| Cost of Revenue | 146,242,000,000 | 136,684,000,000 | 127,891,000,000 | 111,783,000,000 | 95,899,000,000 |
| Gross Profit | 16,829,000,000 | 17,315,000,000 | 16,656,000,000 | 14,199,000,000 | 15,216,000,000 |
| Operating Expense | 13,654,000,000 | 14,385,000,000 | 15,338,000,000 | 12,415,000,000 | 12,134,000,000 |
| Operating Income | 3,175,000,000 | 2,930,000,000 | 1,318,000,000 | 1,784,000,000 | 3,082,000,000 |
| Net Income | 3,305,000,000 | 2,702,000,000 | 1,202,000,000 | 1,347,000,000 | 1,808,000,000 |
| EPS (Diluted) | 6 | 5 | 2 | 2 | 3 |
| EBITDA | 6,200,000,000 | 5,616,000,000 | 4,058,000,000 | 3,813,000,000 | 4,760,000,000 |
| EBIT | - | - | - | - | - |
| Tax Provision | 963,000,000 | 899,000,000 | 760,000,000 | 477,000,000 | 979,000,000 |
| Interest Income | 0 | 0 | 0 | 0 | 0 |
| Interest Expense | 702,000,000 | 725,000,000 | 665,000,000 | 665,000,000 | 728,000,000 |
| Total Expenses | - | - | - | - | - |
| Basic Shares Outstanding | 521,790,000 | 543,319,000 | 575,191,000 | 582,832,000 | 570,722,000 |
| Diluted Shares Outstanding | 523,744,000 | 545,704,000 | 582,040,000 | 590,516,000 | 579,135,000 |
News & Opinions
🧠 Analysis & Opinions on CNC
- Oscar Health’s Selloff May Be Final Wave in Bullish Elliott Cycle
investing.com • Jul 25, 2025 - Centene Stock Up 5% After First Loss In 13 Years, Bullish Guidance
forbes.com • Jul 25, 2025 - 31 Top Companies Hiring Remotely In 2025
forbes.com • Jul 25, 2025
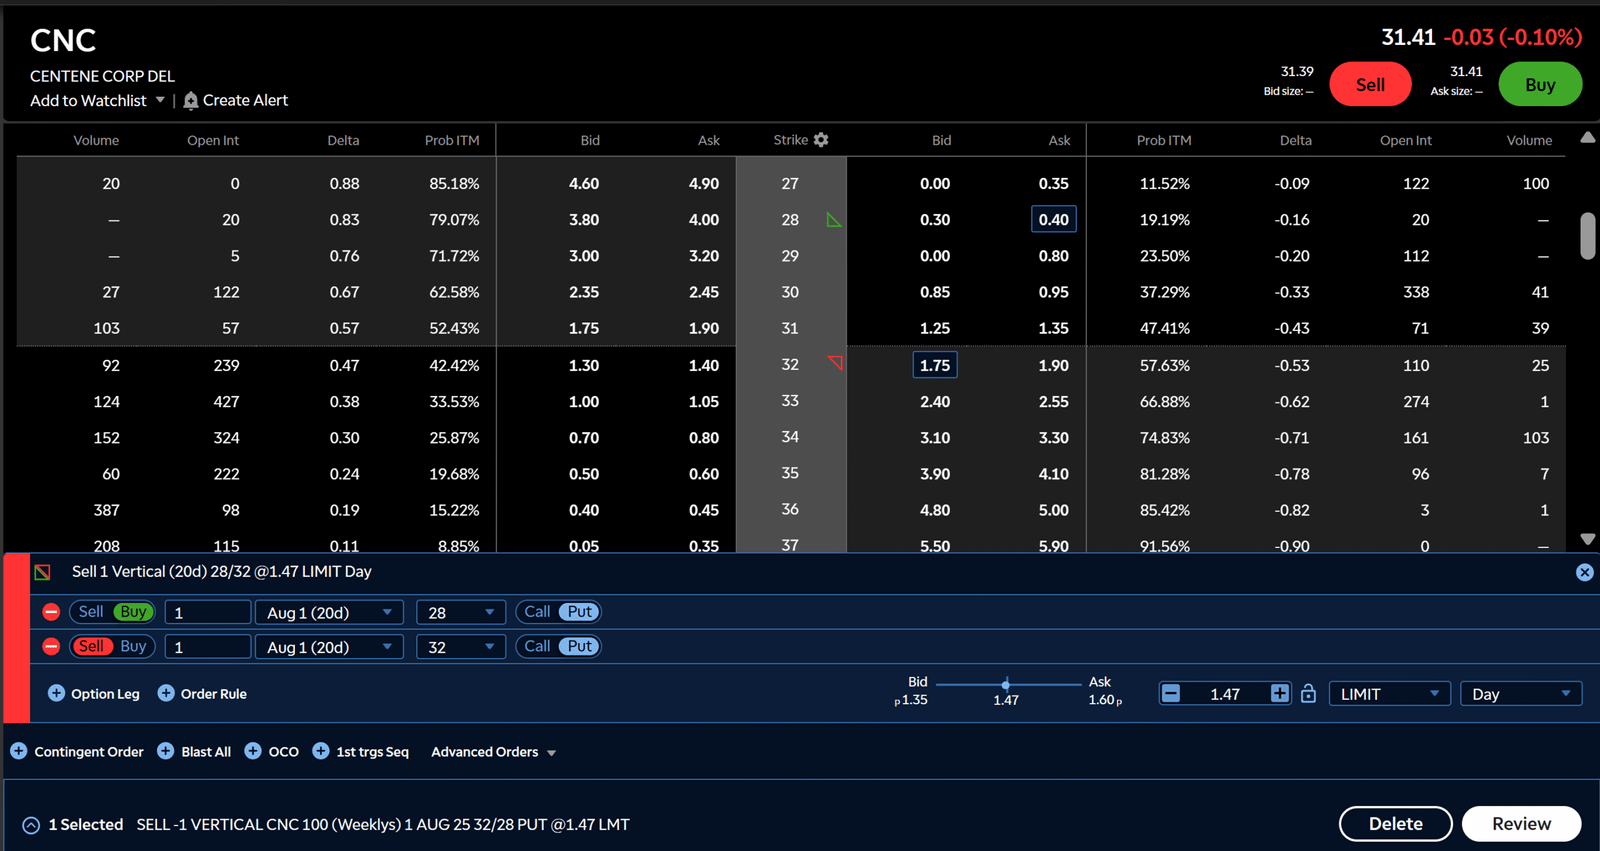
Options Chain
Technical Ratings
📊 Technical Analysis Overview
Auto-loaded insights for today’s featured stock
Each Daily Stock Pick comes with a built-in Technical Analysis Widget, giving you a fast, visual snapshot of the current market sentiment—based on real-time data.
🔎 What You’ll See:
Overall Signal:
A summary at the top:
✅ Strong Buy, 📈 Buy, ⚖️ Neutral, 📉 Sell, or ❌ Strong SellTimeframes:
Switch between views (1min, 15min, 1hr, Daily, Weekly) to match your trading style—short-term or long-term.Breakdown of Indicators:
Moving Averages – trend-following tools
Oscillators – momentum indicators like RSI & MACD
Pivots – support and resistance levels
💡 How to Use It:
This widget helps confirm or challenge your trading bias. Use it together with:
Our price targets
Options flow & volatility analysis
Institutional and insider sentiment
📝 VIXTradingHub Analysis


💰 5-Year Financial Overview for CNC
| Metric | 2024 | 2023 | 2022 | 2021 | 2020 |
|---|---|---|---|---|---|
| Revenue | 163,071,000,000 | 153,999,000,000 | 144,547,000,000 | 125,982,000,000 | 111,115,000,000 |
| Cost of Revenue | 146,242,000,000 | 136,684,000,000 | 127,891,000,000 | 111,783,000,000 | 95,899,000,000 |
| Gross Profit | 16,829,000,000 | 17,315,000,000 | 16,656,000,000 | 14,199,000,000 | 15,216,000,000 |
| Operating Expense | 13,654,000,000 | 14,385,000,000 | 15,338,000,000 | 12,415,000,000 | 12,134,000,000 |
| Operating Income | 3,175,000,000 | 2,930,000,000 | 1,318,000,000 | 1,784,000,000 | 3,082,000,000 |
| Net Income | 3,305,000,000 | 2,702,000,000 | 1,202,000,000 | 1,347,000,000 | 1,808,000,000 |
| EPS (Diluted) | 6 | 5 | 2 | 2 | 3 |
| EBITDA | 6,200,000,000 | 5,616,000,000 | 4,058,000,000 | 3,813,000,000 | 4,760,000,000 |
| EBIT | - | - | - | - | - |
| Tax Provision | 963,000,000 | 899,000,000 | 760,000,000 | 477,000,000 | 979,000,000 |
| Interest Income | 0 | 0 | 0 | 0 | 0 |
| Interest Expense | 702,000,000 | 725,000,000 | 665,000,000 | 665,000,000 | 728,000,000 |
| Total Expenses | - | - | - | - | - |
| Basic Shares Outstanding | 521,790,000 | 543,319,000 | 575,191,000 | 582,832,000 | 570,722,000 |
| Diluted Shares Outstanding | 523,744,000 | 545,704,000 | 582,040,000 | 590,516,000 | 579,135,000 |
🧠 Analysis & Opinions on CNC
- Oscar Health’s Selloff May Be Final Wave in Bullish Elliott Cycle
investing.com • Jul 25, 2025 - Centene Stock Up 5% After First Loss In 13 Years, Bullish Guidance
forbes.com • Jul 25, 2025 - 31 Top Companies Hiring Remotely In 2025
forbes.com • Jul 25, 2025
📊 Technical Analysis Overview
Auto-loaded insights for today’s featured stock
Each Daily Stock Pick comes with a built-in Technical Analysis Widget, giving you a fast, visual snapshot of the current market sentiment—based on real-time data.
🔎 What You’ll See:
Overall Signal:
A summary at the top:
✅ Strong Buy, 📈 Buy, ⚖️ Neutral, 📉 Sell, or ❌ Strong SellTimeframes:
Switch between views (1min, 15min, 1hr, Daily, Weekly) to match your trading style—short-term or long-term.Breakdown of Indicators:
Moving Averages – trend-following tools
Oscillators – momentum indicators like RSI & MACD
Pivots – support and resistance levels
💡 How to Use It:
This widget helps confirm or challenge your trading bias. Use it together with:
Our price targets
Options flow & volatility analysis
Institutional and insider sentiment
Options Chain
Select an expiration date to expand for table with strikes, greeks, and mark.
Join the Early Access List
“Get exclusive updates and launch bonuses.”

