🏥 UnitedHealth Group (UNH) – Deep Dive Analysis
📊 1. Oversold (RSI < 30, bounce setup)
UNH has dropped ~40–50% YTD, with RSI reaching ~28 in mid-May and now recovering—indicating the start of a potential rebound from serious oversold levels optioncharts.io+4marketchameleon.com+4tipranks.com+4reddit.com.
📈 2. MACD at valley, beginning to rise
Following the sharp decline, UNH’s MACD was deeply negative and has now crossed higher on the daily chart, signaling positive momentum reversal .
🏦 3. Institutional ownership & recent inflows
Ministered by strong trust, ~88% of shares are institutionally held. Firms like Vanguard, Wellington, and Norges increased their positions in Q1, with inflows outpacing outflows by billions marketbeat.com+2marketchameleon.com+2nasdaq.com+2.
📥 4. Top insiders buying
CEO Steve Hemsley (~$25M), CFO, and other directors purchased a combined $31.6M in Q2—powerful reinforcement of internal confidence tipranks.com+1reddit.com+1reddit.com+1reuters.com+1.
🧑💼 5. Analyst price-target increases
KeyCorp (PT $400) and Piper Sandler ($353) boosted targets following dividend hike; consensus now sits at ~$428 (+41%) from ~$303 marketbeat.com.
📅 6. Near-term catalysts
Q2 earnings: July 15
Dividend raised 5.2% ($2.21/share) with record date June 16, payout June 24 marketbeat.com
Management refocusing on cost controls and restoring guidance
🛡️ 7. Recession-resistant & emerging tech
UNH is defensive via healthcare/Medicare; its Optum unit is a tech-powered profit engine (~43% of revenue/profit growth) reuters.com.
📚 8. Strong fundamentals & cash flow
UNH generates ~$20B+ free cash flow, has a modest P/E (~13–15), and sustains solid earnings (40–50% TTM growth) .
⚙️ 9. Liquid options with call bias
Unusually high call volume (~162K contracts, +29%) and put/call ratio (~0.47), with LEAPS call positioning showing strong bullish sentiment .
🔻 10. Significant drop & bounce started
UNH plunged ~50% amidst cost concerns; insider accumulation and bottom-chart signals now suggest the selling pressure has abated .
🚀 11. LEAPS call liquidity (for leverage)
Deep-in-the-money and out-of-money LEAPS calls—including 2027 $280–$400 strikes—are active, indicating expectations of long-term recovery .
🧠 Thesis Summary
UnitedHealth ticks all 11 criteria:
Deeply oversold technically (RSI/MACD),
Powerful insider & institutional buying,
Robust bullish options flow,
Price-target resets (>40% upside),
Catalyst-driven Q2 results + dividend raise,
Defensive healthcare utility aided by tech capabilities via Optum,
Strong free cash flow and value pricing,
LEAPS-ready play for long-term upside.
✨ Investment thesis: UNH is a rare mega-cap opportunity where all signals—technical, fundamental, insider, and options—are aligned. A turnaround is underway as leadership styles reinforce and the cost outlook stabilizes. Strategic entry now may yield multi-year gains.
🧭 Stock Trade Strategy for UNH (UnitedHealth Group Inc)
📍 Current Price: $303.22
🎯 Analyst Price Target (Consensus): $370–410
🧠 Thesis: UNH is showing strong technical rebound signals with fundamental support (high cash flow, defensive sector), and upside catalysts in Q2–Q3 2025 (earnings, policy clarity). The stock has dropped significantly but found a base around $290–300.
📈 Entry Strategy
Buy Range: $300–305
Enter on dips or breakouts above 50-day SMA with volume confirmation.
🎯 Profit-Taking Zones
Target 1: $345 (mid-resistance + gap-fill)
Target 2: $370 (analyst average target)
Target 3: $410 (high-end valuation target and previous highs)
🪜 Consider scaling out:
30% at $345
40% at $370
30% at $410
⛔ Stop-Loss Strategy
Hard Stop: $284 (under recent consolidation lows)
Trailing Stop Option: Trail by 8–10% after hitting Target 1
🔒 Risk: No more than 2% of total portfolio value on this single position. Adjust share size accordingly.
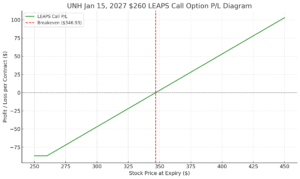
🎯 UNH Options Trade Strategy (LEAPS Call Play)
Underlying Price: $303.22 (as of June 8, 2025)
Options Contract: Jan 15, 2027 $260 Call
Premium (Cost per Share): $86.93
Delta: ~0.70
Breakeven Price: $346.93
Max Risk: $8,693 per contract
Max Profit: Unlimited
Time to Expiration: ~19 months
🧠 Strategy Thesis
UnitedHealth Group (UNH) is a recession-resilient giant in the healthcare sector. Based on our 11-point deep dive, it:
Just exited a multi-month oversold condition (RSI < 30)
Has MACD at a reversal point
Strong institutional ownership with inflows
Strong fundamentals & free cash flow
Liquid options with bullish skew
Potential catalysts from policy changes and Q2–Q3 earnings
Thus, a long-dated LEAPS call is justified for directional exposure with limited risk.
📥 Entry Plan
Buy 1x Jan 15, 2027 $260 Call @ ~$86.93
Capital outlay per contract = $8,693
Choose entry only after confirmation of bounce from oversold and rising MACD (currently in early stage)
📈 Profit Targets
Target 1 (Moderate rally): UNH @ ~$360
Value ≈ $100 intrinsic → ~15% gain
Target 2 (Bullish continuation): UNH @ ~$400
Value ≈ $140 intrinsic → ~60% gain
Target 3 (Stretch target): UNH @ ~$450
Value ≈ $190 intrinsic → >100% gain
Trail stop: If price accelerates >$375, set a trailing stop on option price (e.g., 20%)
🛑 Stop Loss Plan
Hard Stop: If UNH closes below $280 for 3 consecutive days (breaks recent support), cut loss
Max loss = Premium paid: $8,693
Alternatively, trail option value if it drops >50% of entry cost (~$43), reassess position
⏳ Time Horizon
Holding Period: 6–15 months
Ideal for medium- to long-term investors targeting healthcare outperformance during economic slowdowns
Can be exited earlier if profit targets hit sooner
⚠️ Risk Warning & Protective Disclaimer
This trade idea involving UnitedHealth Group (UNH) using the Jan 15, 2027 $260 Call LEAPS is for educational and informational purposes only. It is not financial advice or a solicitation to buy or sell securities.
Options trading involves significant risk, including the loss of your entire investment.
You should not risk more than 2% of your total capital on any single trade—even one with a high delta like this LEAPS call.
This trade should be considered only if you have high conviction, proper risk controls, and understand how options behave over time.
Be aware of time decay (Theta), implied volatility shifts, and early assignment risks if the call goes deep ITM.
We recommend that you:
Use a stop-loss or exit strategy if the trade moves against you
Monitor earnings dates, macro catalysts, and healthcare policy news
Consult a licensed financial advisor before entering real-money positions
🛡️ Capital preservation and position sizing matter more than chasing gains. Your long-term success comes from consistency, discipline, and risk control—not oversized bets.